Quantify Me

data-driven materialisation


With the continuous rise of smartwatches, fitness trackers and other wearable devices the amount of personal data that one constantly collects keeps growing endlessly. Steps, active energy, sleep, heart rate, blood sugar, blood pressure, weight, calories, nutrition, water intake, meditation, activities, places, means of transport, screen time, productivity, workouts, mood, stairs, body-fat, social interaction, music are just a few of the things that can be easily recorded. Most of this data leads to something that is commonly referred to as the “quantified self,” which is both a cultural phenomenon of self-tracking through technology and a community of consumers and suppliers of self-tracking tools who share an interest in self-knowledge and personal improvement through numbers.

Whilst the quantified self-movement has faced varied criticism related mostly to issues of data privacy and health literacy skills, the focus of this course was less on individual perfection or social challenges but rather on the question, how these tools could be useful for us as designers.

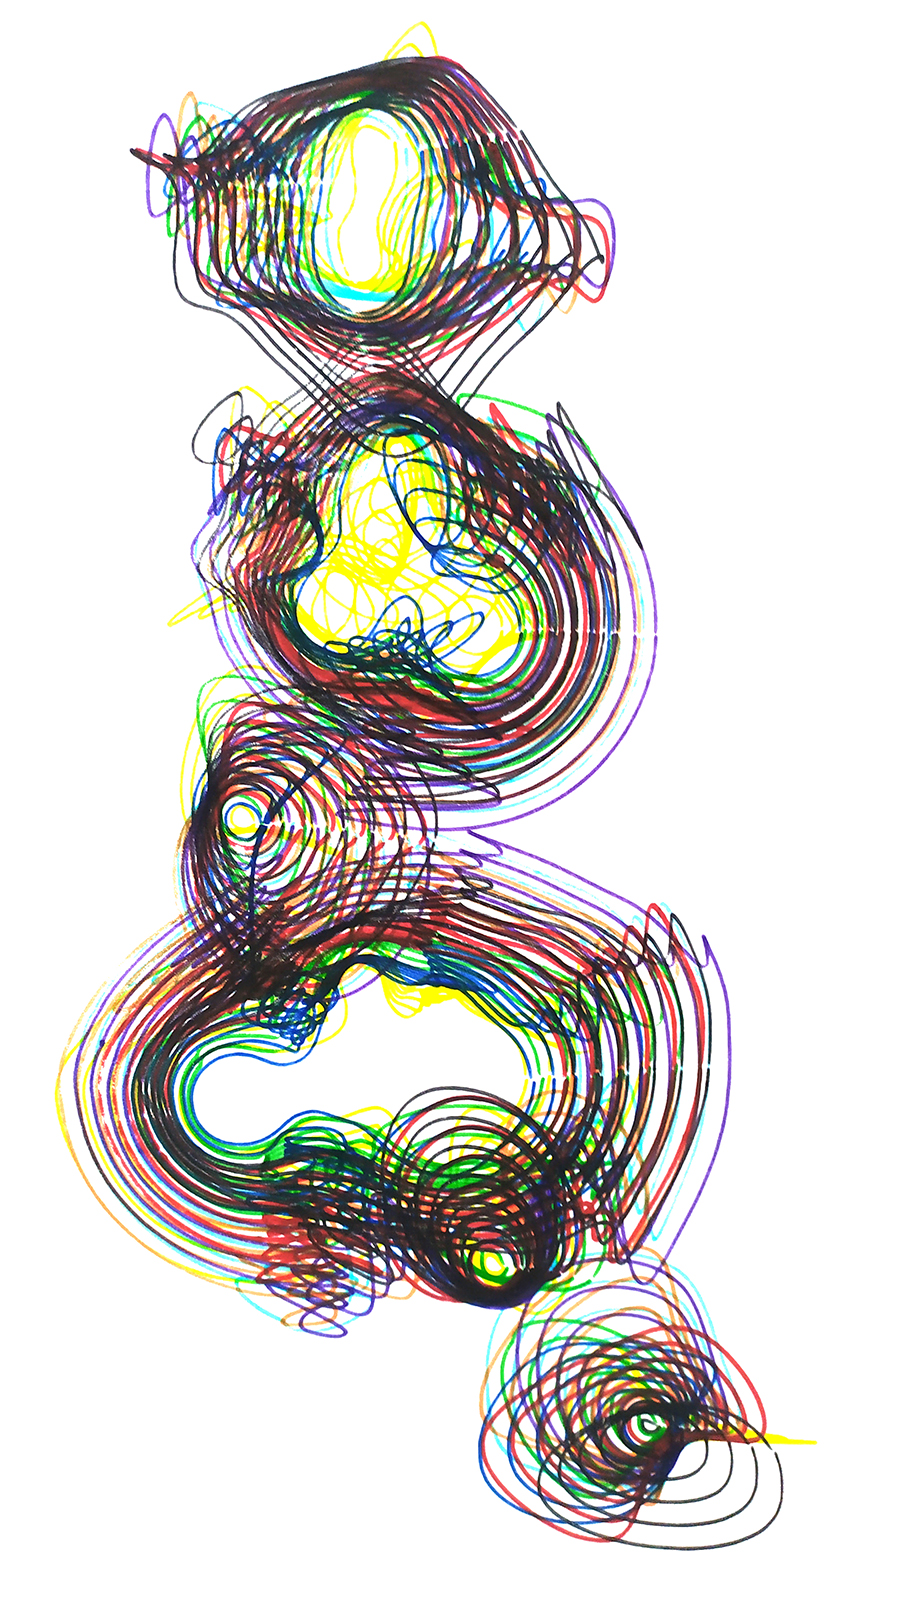
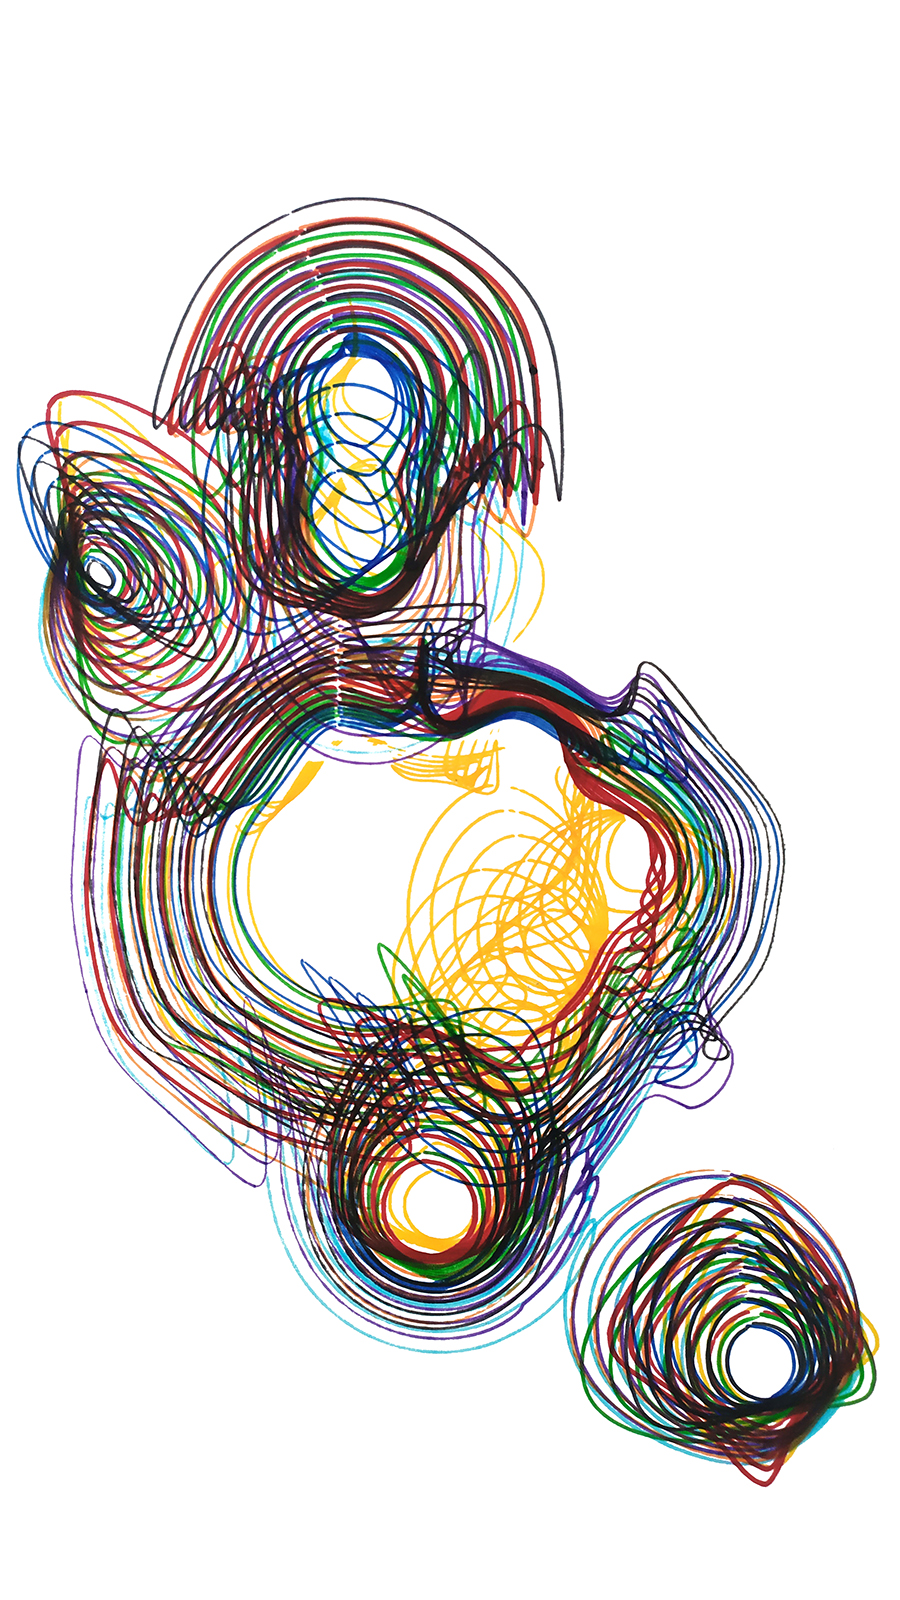
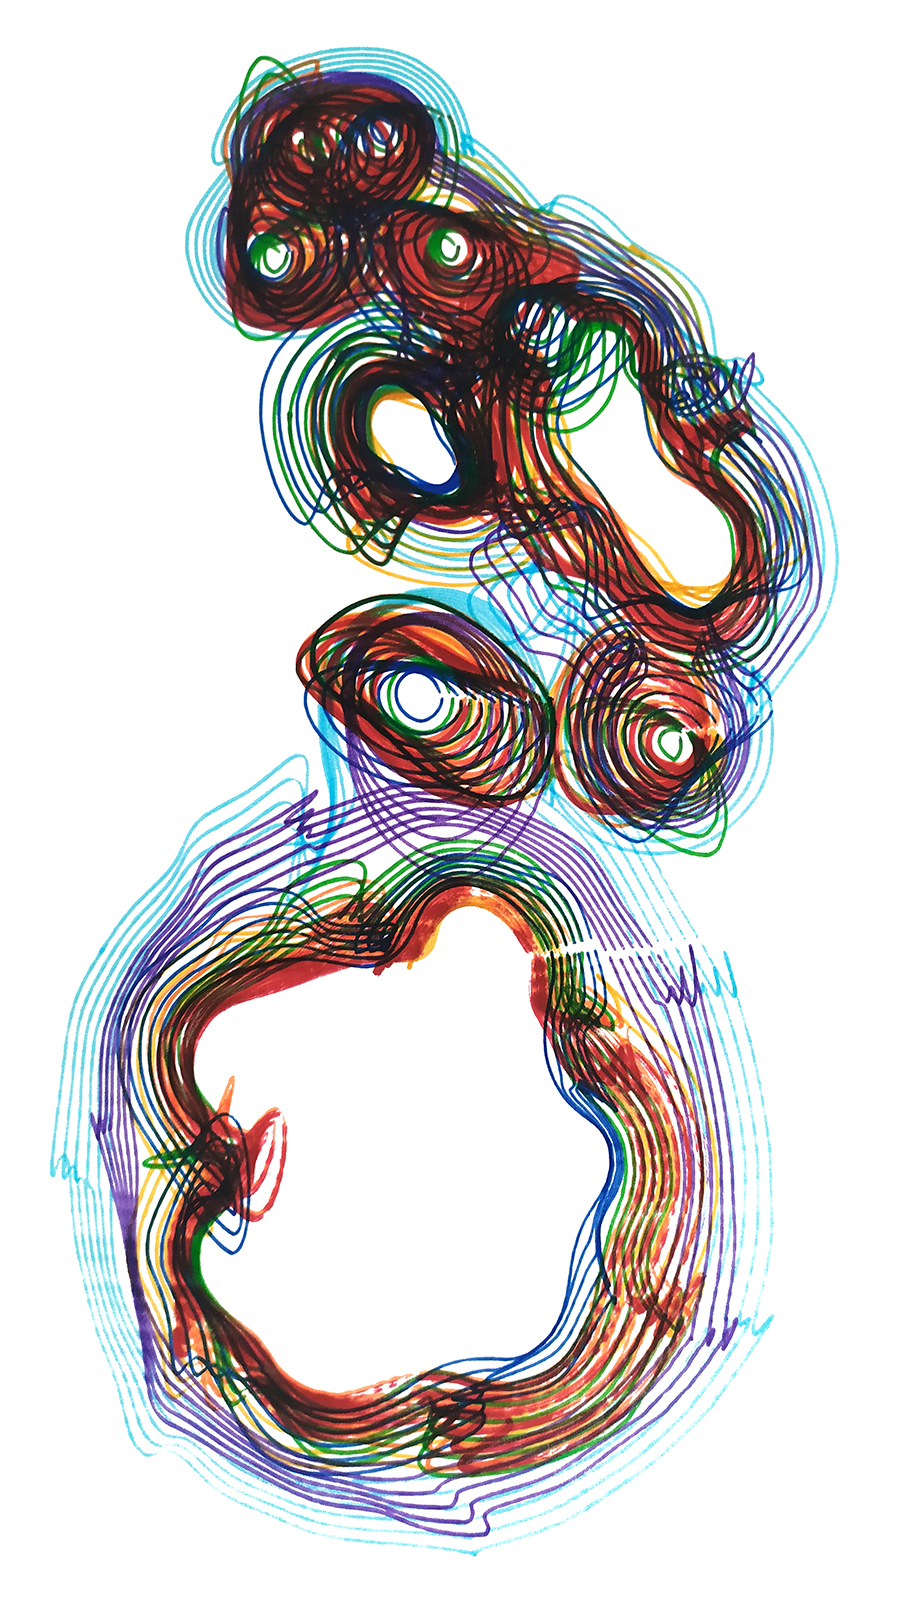
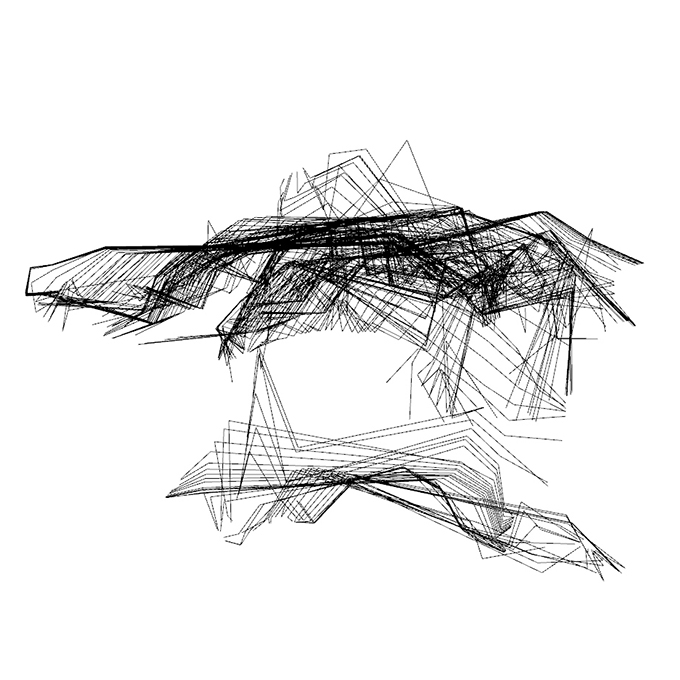
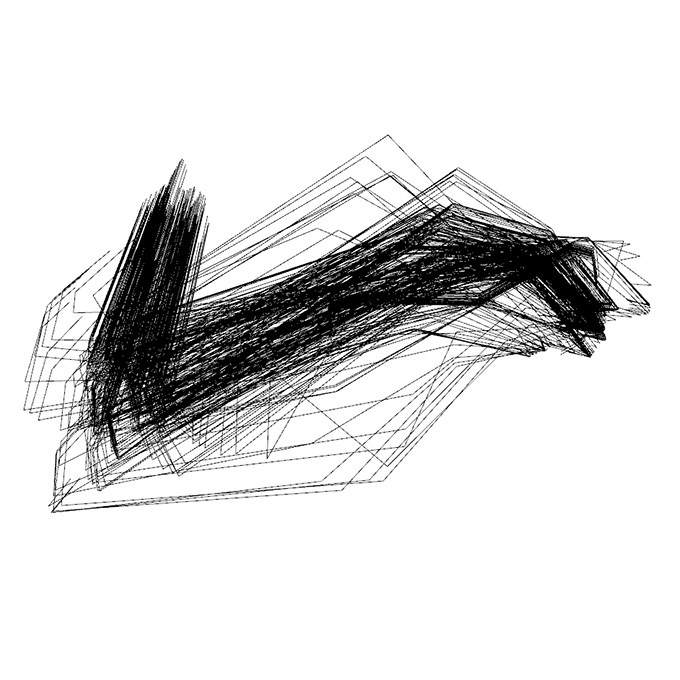
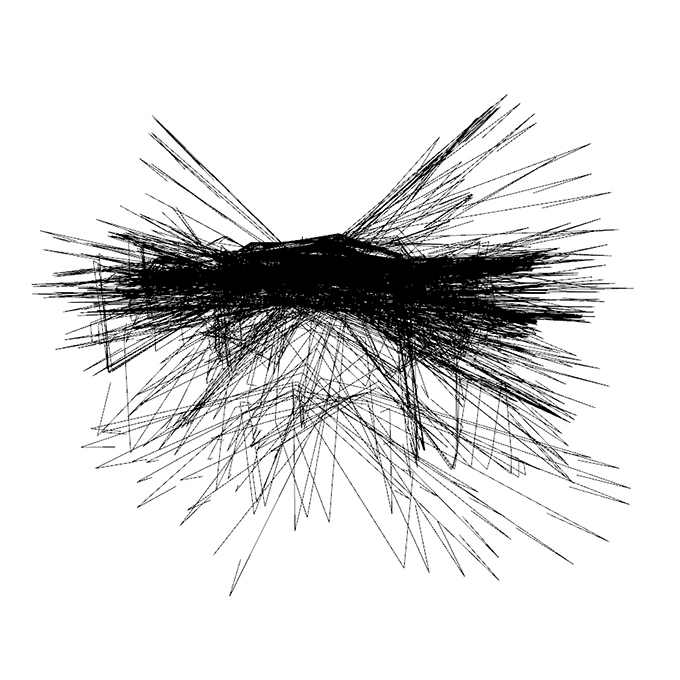
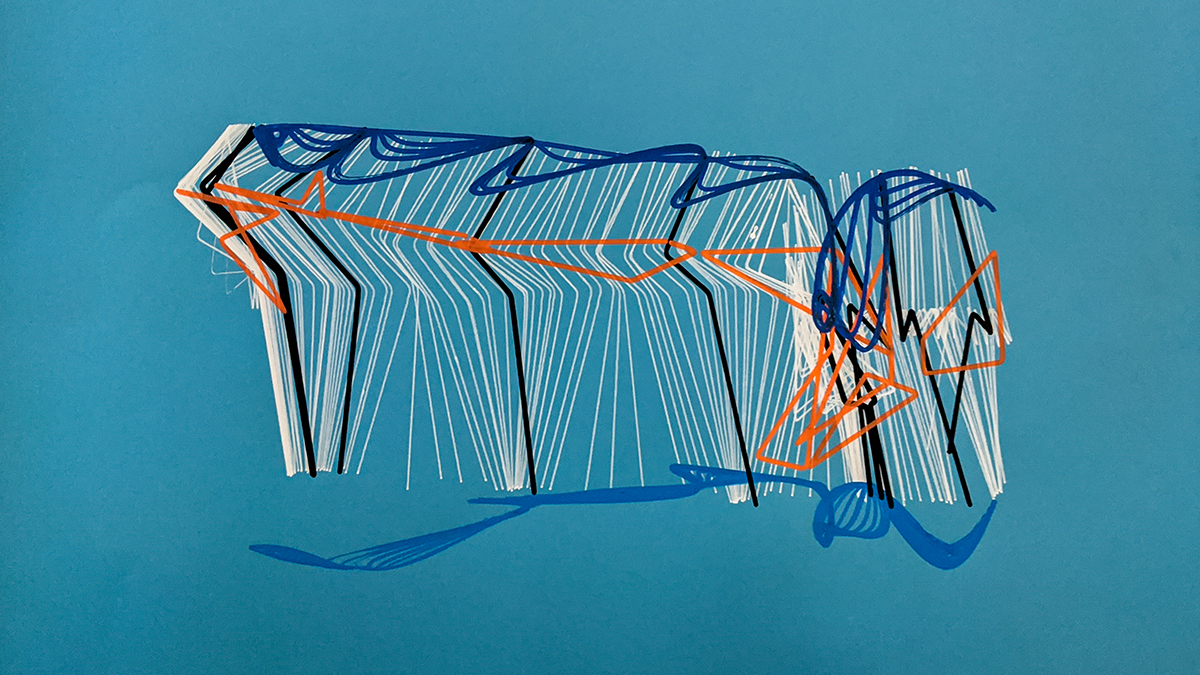
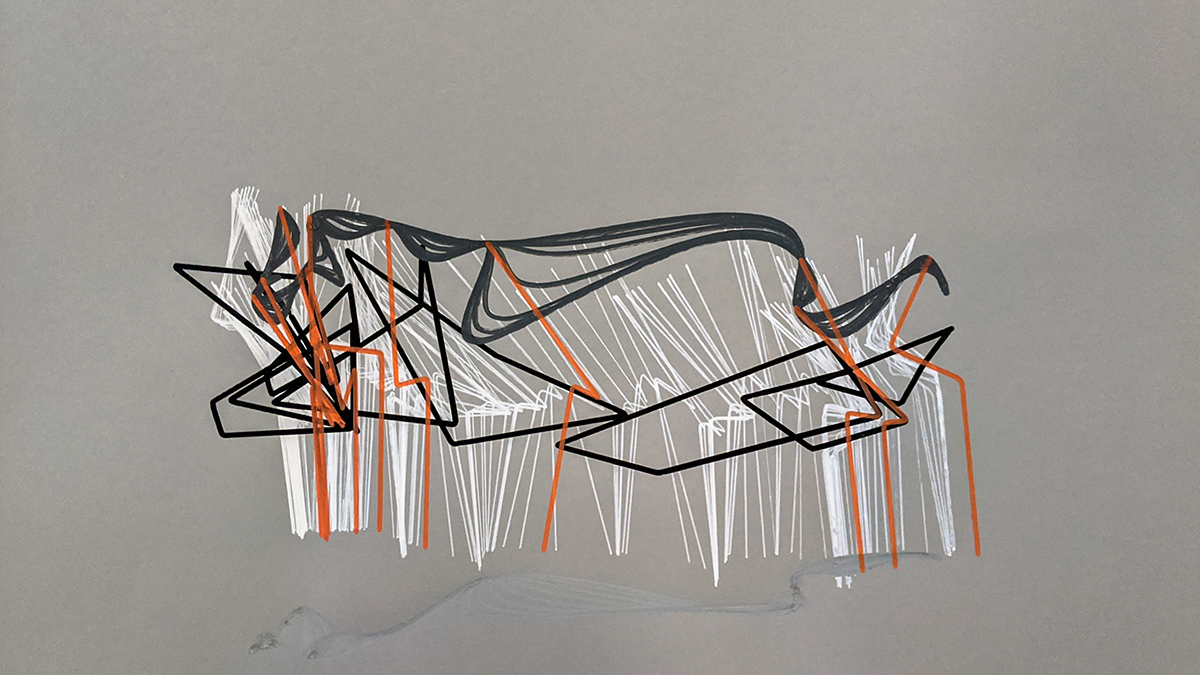
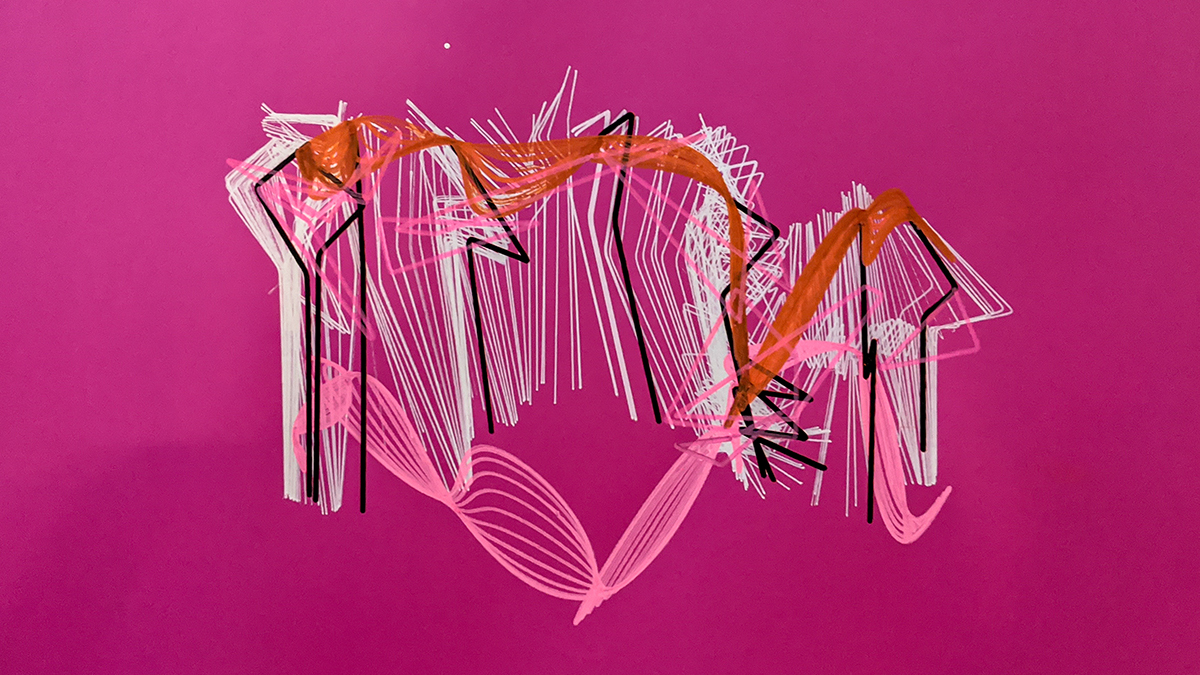
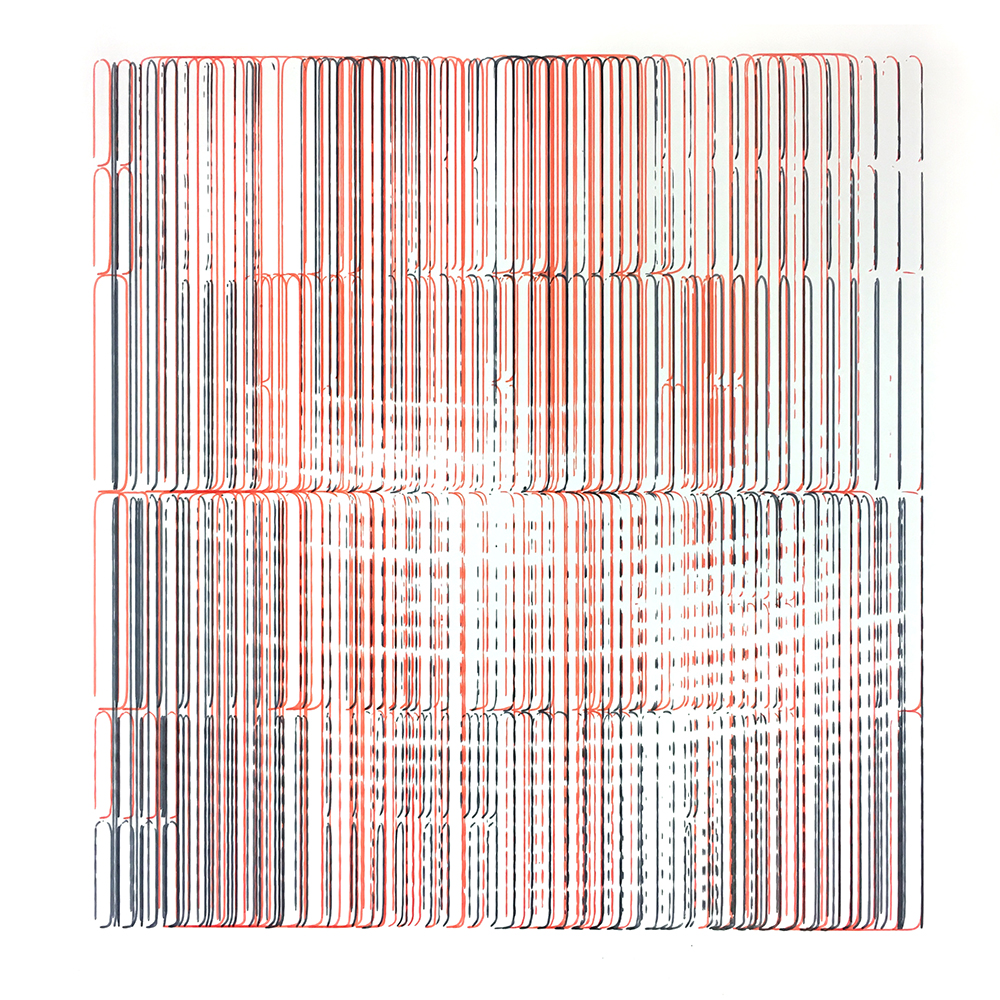
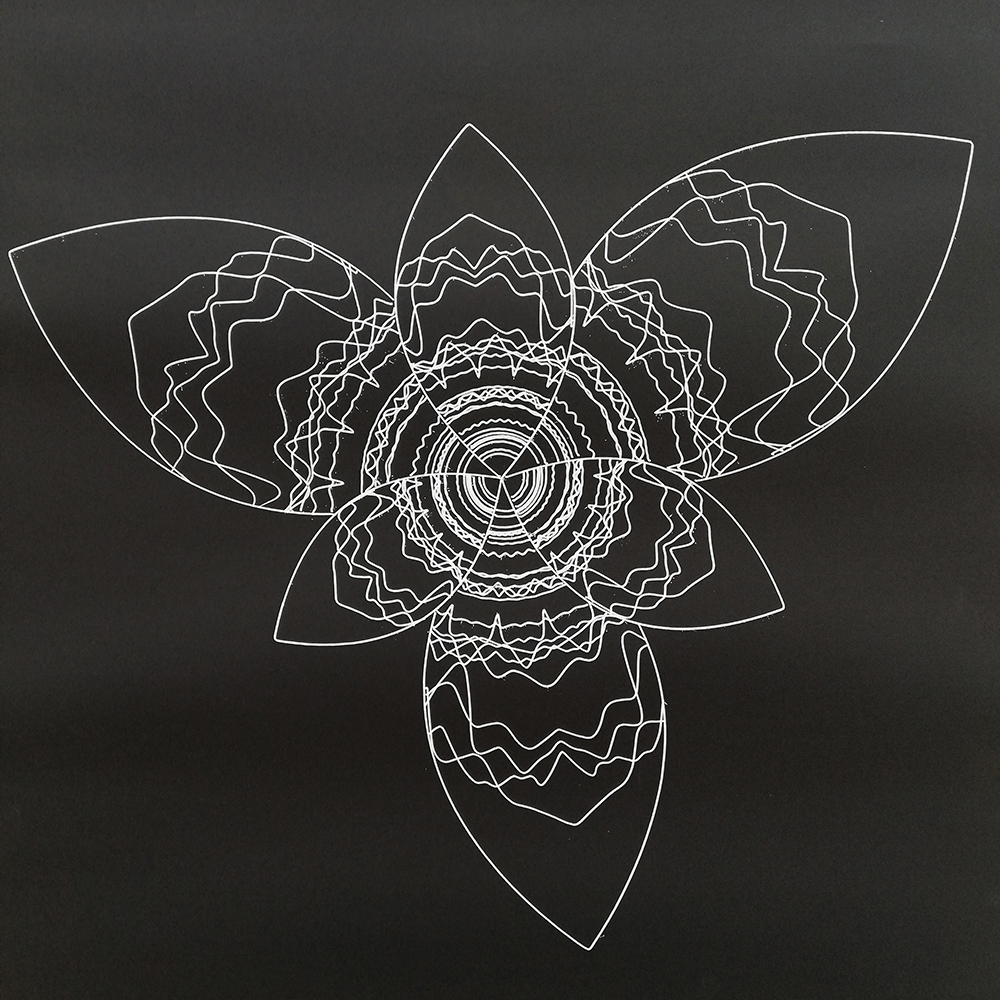
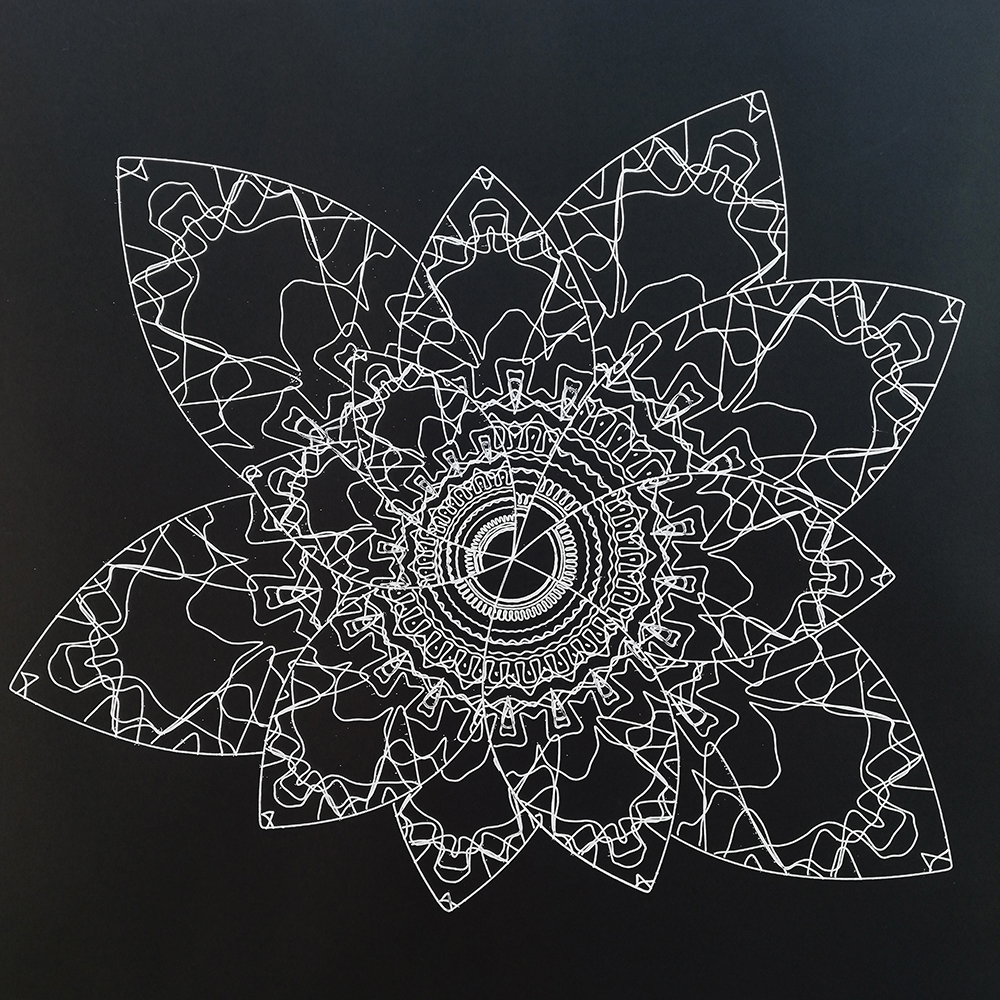
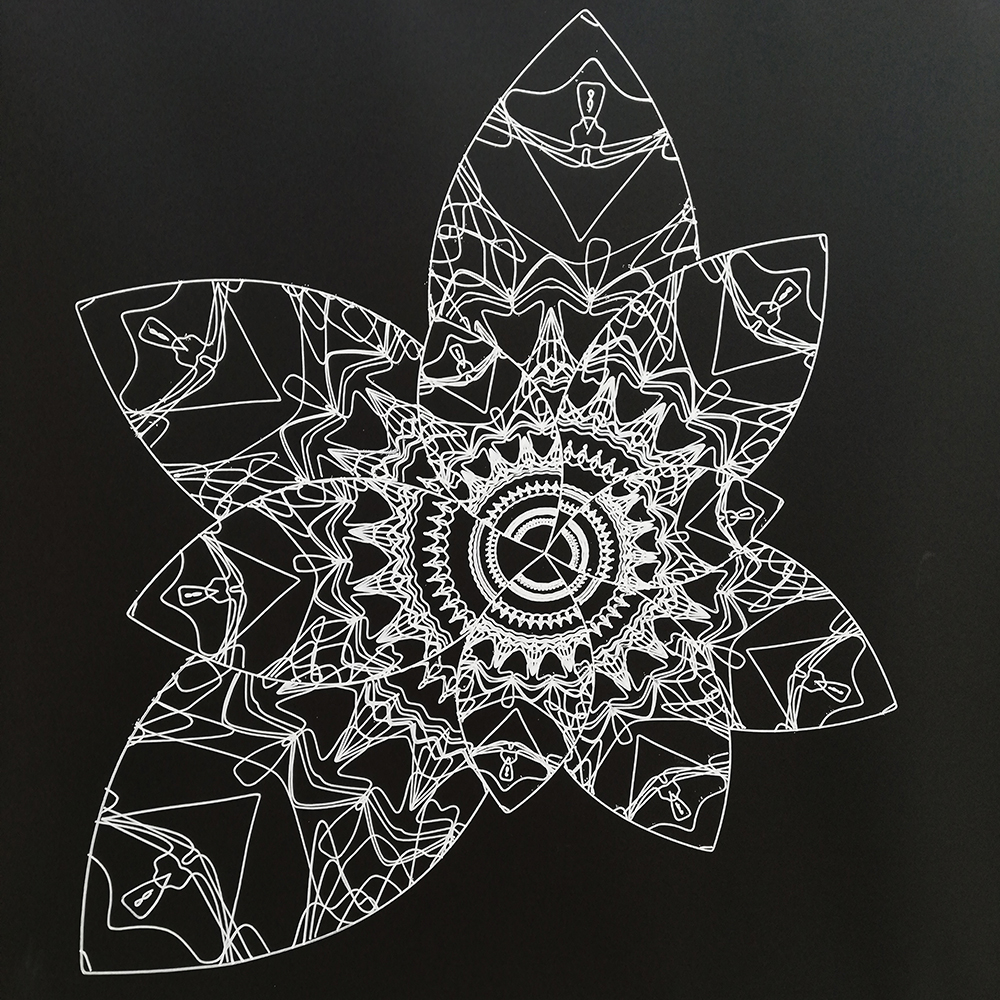
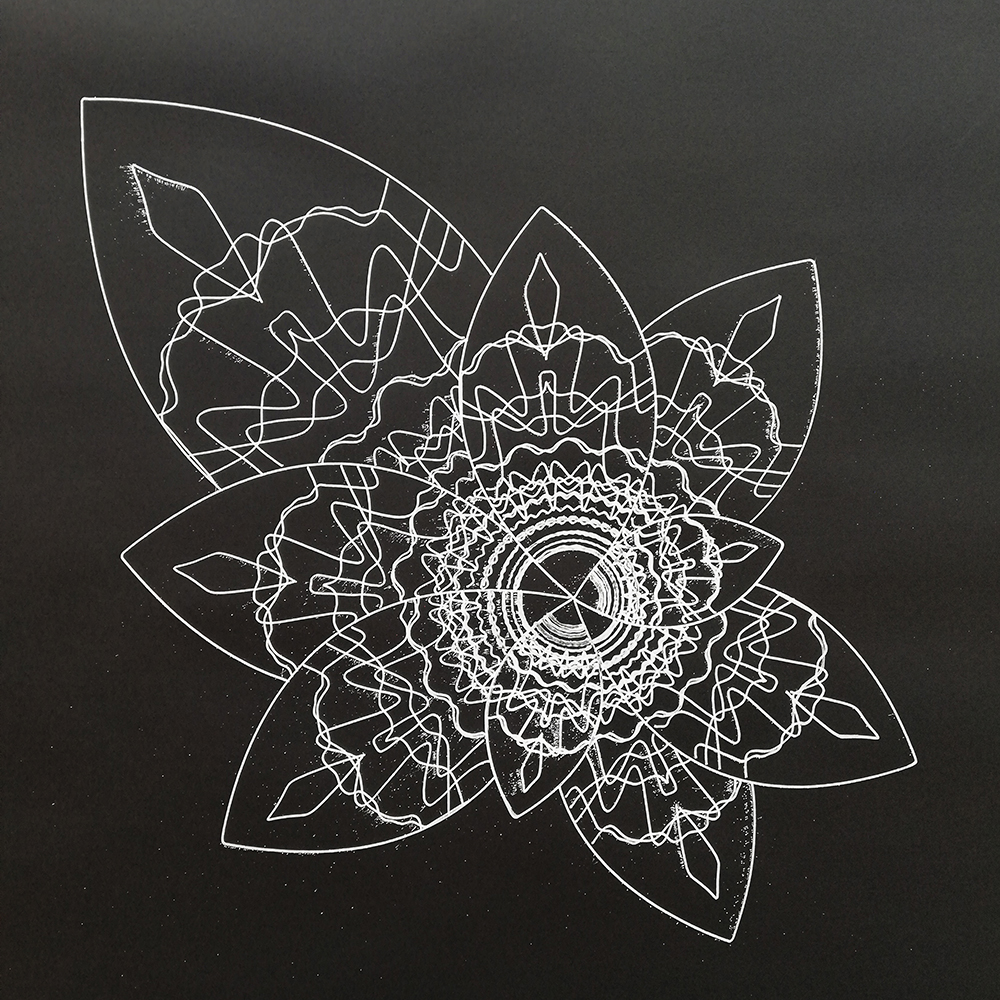
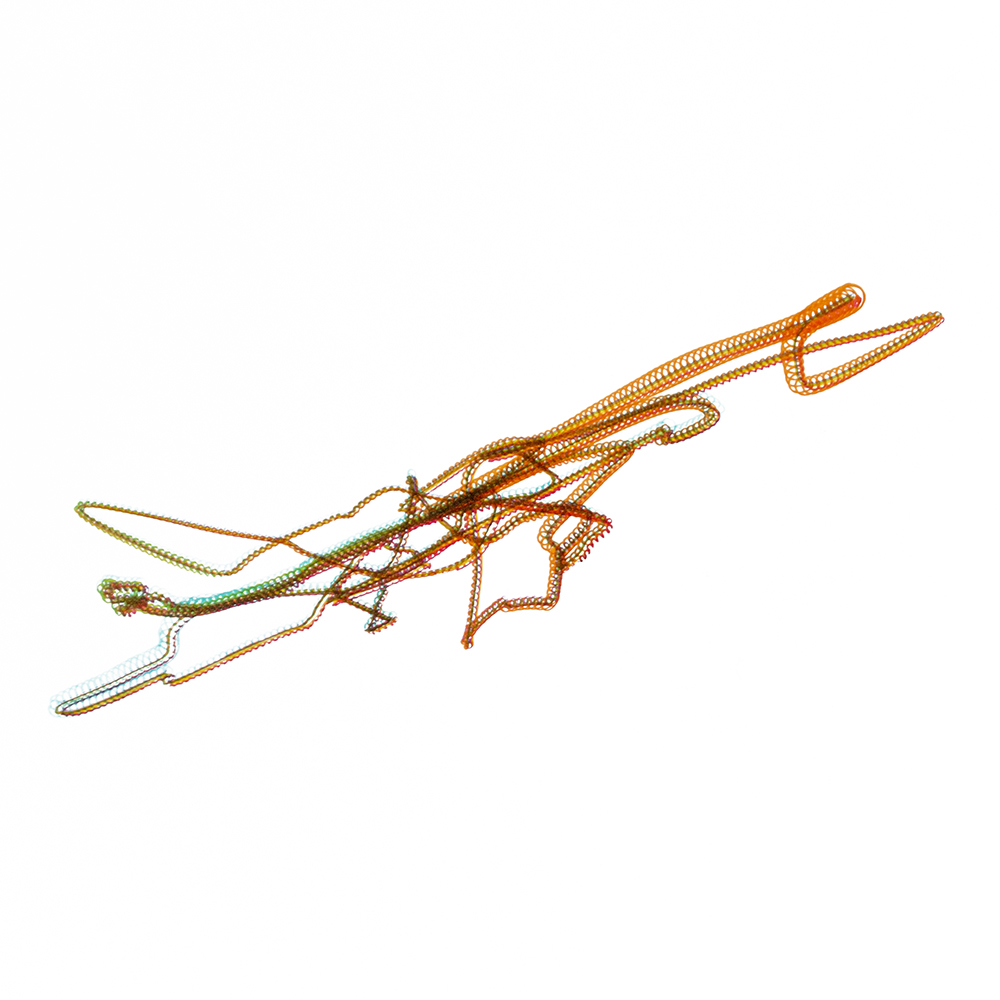
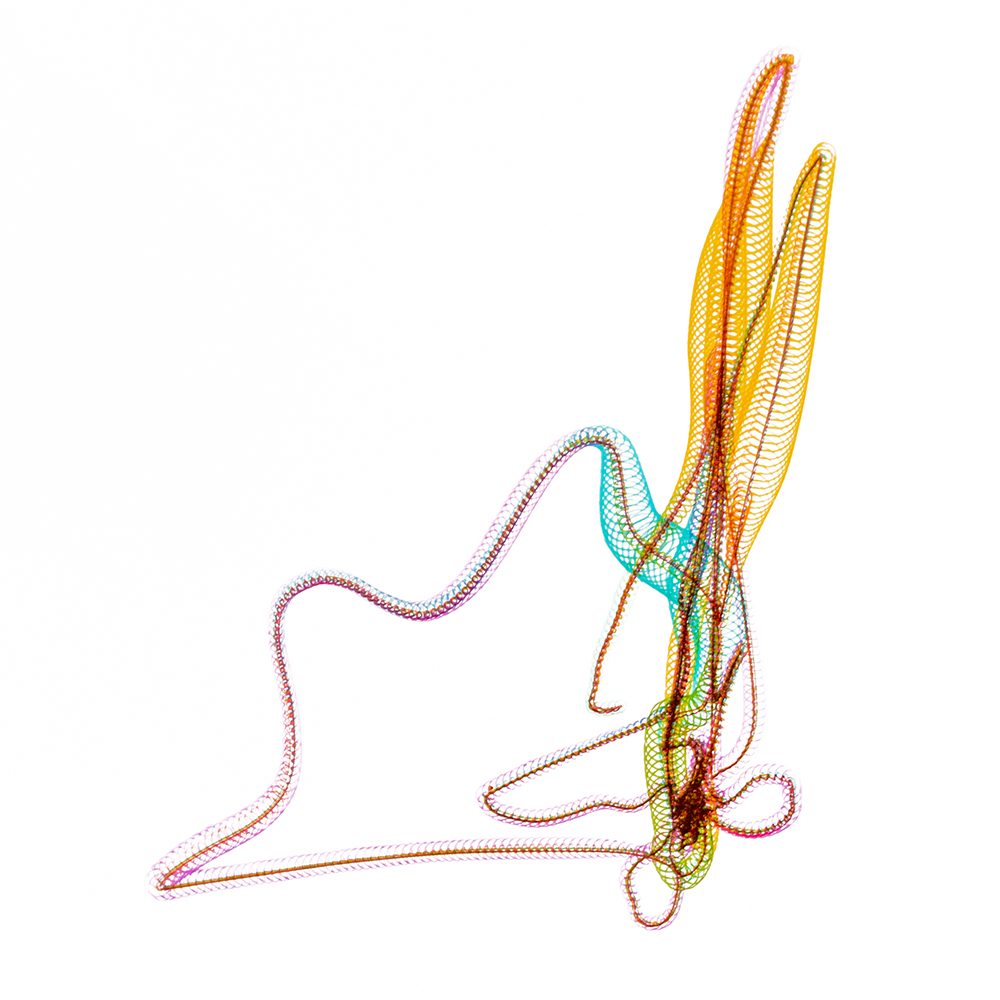
Students in this course worked in interdisciplinary teams, comprised of both architecture and design students. The first task was to understand and decide what types of personal data each group can collect, how they vary among different persons and situations and how they can be compared or combined. Depending on the extent of these numeric figures the groups were then asked to develop methods to manipulate and translate the results and finally decide on how they can be visualized using an industrial robot. The sets of paintings should both show that they belong to the same procedure but also stand for their individuality.

Topography of Boredom

People today can not imagine their lives without smartphones. They are no longer just devices for communication but have become an extension of our brains. Smartphone sensors collect hundreds of different sets of data every few seconds. What if these sets of data can be a design driver?

Institute
Dessau Department of Design & Dessau Institute of Architecture

Students
Topography of Boredom: Niloufar Rahimi, Andrii Kniaz, Daksha Suryavamshi. Ultraconscious: Bruno Apley, Shady Maher, Vijayaraj Manmathan. Brainwaves: Cindy Schmidt, Gulyuzbonu Ruziboeva, Maryem Lachgar, Salam Yousef. The Character of Dance: Işınsu Ağca, Vanessa Juliet Nahr, Shubham Thakur, Oleksandr Khabailiuk. Glitch Hunting: Pouriya Alighardashi, Ashish J Varshith, Khrystyna Pundak. Emotions Quantify Me: Sanem Bakan, Fariza Mayasari, Martin Naumann, On Mei Leung

Tutors
Adib Khaeez, Valmir Kastrati, Manuel Lukas, Aleksandra Sviridova

Supervision
Sina Mostafavi, Prof. Manuel Kretzer


We decided that such data could be used in architecture, especially urbanism. We focused on the fact that certain areas of a city are usually much more attractive to people than the others. Sometimes it is a matter of crossing pedestrian paths or a well-placed public space. But sometimes things are not so obvious, like the old shady tree you want to sit under or an interesting sculpture in the park you see every day walking your dog. Our hypothesis was that in an interesting place you want to spend time and even take photos, but a boring one you want to leave as soon as possible. The aim of our project was to identify such attractive places on the campus of our university and develop a model that can then be used on a larger scale of the city. We believe that such data in the future will be able to indicate which spaces are “working” and which need changes and rethinking.

The Character of Dance

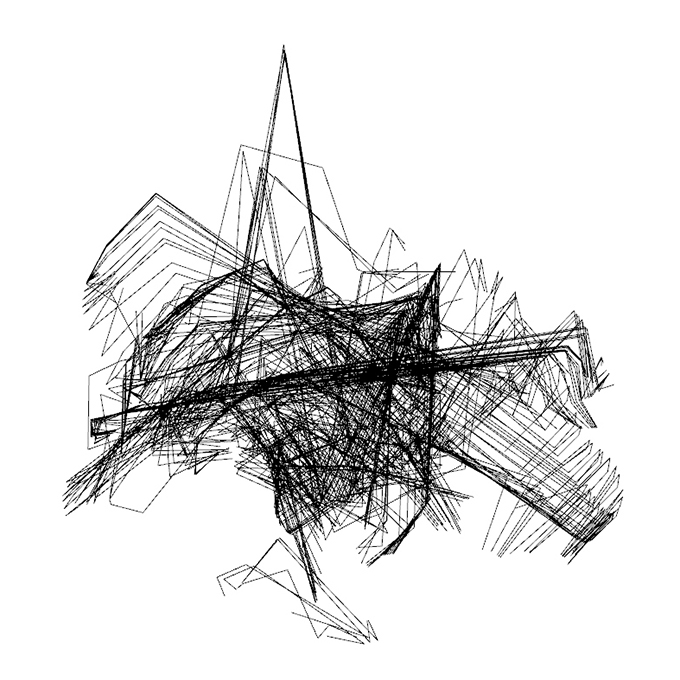
The idea of the extraction of dance movements originated from the thought of how we can translate body characteristics into graphical patterns. We used a Microsoft Kinect camera in order to get skeleton data and visualized it using Rhino and Grasshopper Firefly.  As a result we created a compilation of different patterns, according to varying types of dance movements seen from above: Jive, Tango, Meringue, Cha Cha Cha, Waltz, Ballet, Disco-fox, Salsa.

Ultraconscious

The concept was to express the effects of surveillance on the human movement within a space. The artwork compares three different states of conscious movement: The first, “Surveillance”, is the passive observation of the subconscious movement under normal circumstances. The second, “Restriction”, is surveillance emphasized. It is the active observation of conscious movement under limiting circumstances. The third one, “Control”, is surveillance vanquished. It is the passive observation of the active ultraconscious movement, regaining power and authority over the watching eye. All lines were derived from the physical surveillance of a simple social experiment promoting these behaviours.

Glitch Hunting

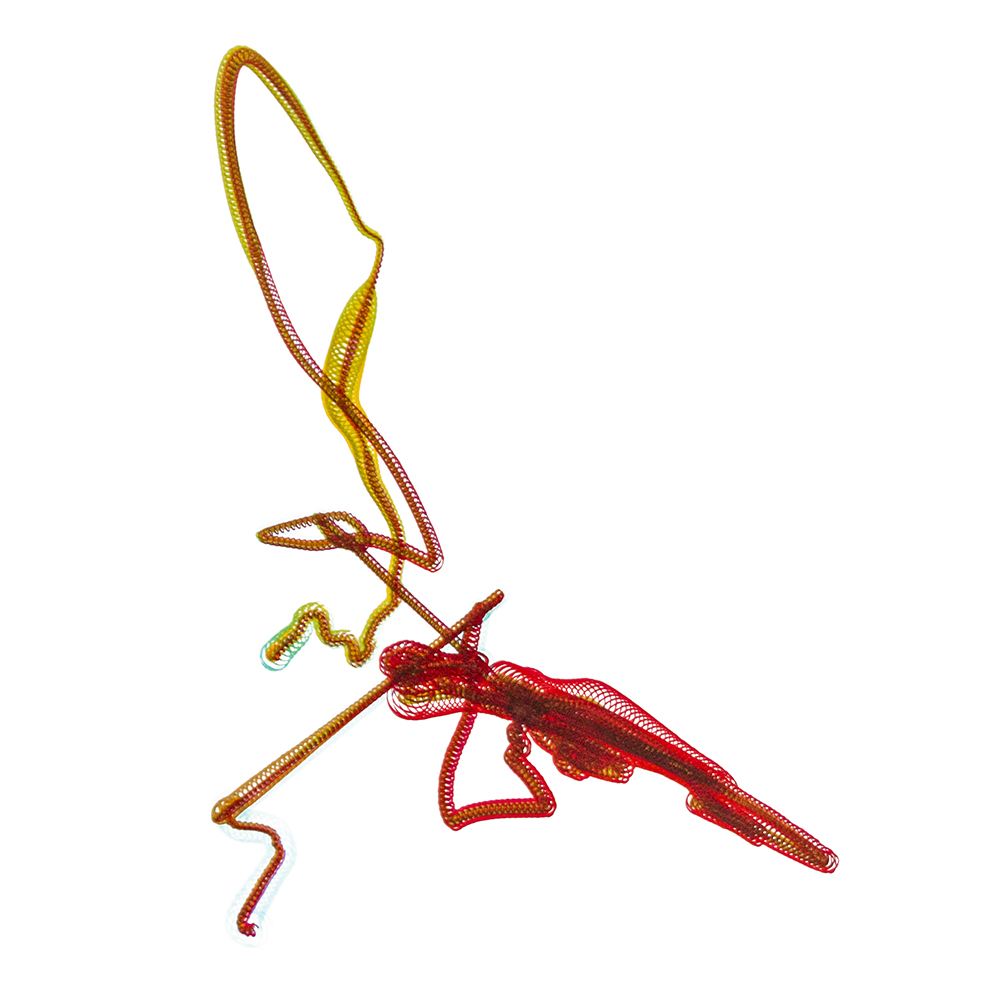
A glitch is a small problem or error in the system which prevents the system from being successful or working as well as planned. The role of glitches in history is underestimated because it is invisible. Although it is one of the most prominent reasons for mutation as one small malfunction in the structure of a gene causing the transmission to a subsequent generation. On the other hand, we are facing an era full of protests for freedom all over the world. In this kind of situation, Geolocation Data has a vital role and being invisible or not being in the planned location even for just a moment is helpful. By focusing on the moments when a glitch happens, we tried to emphasise the role of the glitch. In order to do so, we gathered our geolocation data via different platforms to find our own glitches.

Brainwaves

Do we all experience the same piece of music similarly? To understand how people react while listening to the same song, we chose to measure our brainwaves using a MyEmotiv head device. Taking turns, each of the group members wore the head device and headphones and listened to a song for two minutes. During that time, the device was capturing brainwaves activity and quantifying them into six types of feelings. Each one of those emotions was then illustrated in a graph. To materialize our dataset, we developed a computational framework that takes the emotion graphs as initial input, from which we obtained the first generative form. Using exact parameters to generate all the patterns, all outcomes were distinctly different. However, to emphasis the differences, a second set of algorithms was adapted from which we obtained the final output. The resulting forms are unique from one person to another in terms of patterns and shapes. To conclude, based on our experiment, songs which we listened to might have a theme, but each person experiences the same song differently.

Emotions Quantify Me

Emotions, in general, are always subjective and immeasurable, but by analyzing the topology of human facial expressions we were able to quantify that information. To create emotional reactions, we decided to let people watch a selected short movie, which means letting them be influenced by motion pictures, sound, and a storyline. To visualize the results in a way, beyond usual info-graphics we translated the collected data into an abstract geometry and materialized them with a robotic arm.

Institute
Dessau Department of Design & Dessau Institute of Architecture

Students

Topography of Boredom: Niloufar Rahimi, Andrii Kniaz, Daksha Suryavamshi. Ultraconscious: Bruno Apley, Shady Maher, Vijayaraj Manmathan. Brainwaves: Cindy Schmidt, Gulyuzbonu Ruziboeva, Maryem Lachgar, Salam Yousef. The Character of Dance: Işınsu Ağca, Vanessa Juliet Nahr, Shubham Thakur, Oleksandr Khabailiuk. Glitch Hunting: Pouriya Alighardashi, Ashish J Varshith, Khrystyna Pundak. Emotions Quantify Me: Sanem Bakan, Fariza Mayasari, Martin Naumann, On Mei Leung

Tutors
Adib Khaeez, Valmir Kastrati, Manuel Lukas, Aleksandra Sviridova

Supervision
Sina Mostafavi, Prof. Manuel Kretzer


Privacy Settings
We use cookies to enhance your experience while using our website. If you are using our Services via a browser you can restrict, block or remove cookies through your web browser settings. We also use content and scripts from third parties that may use tracking technologies. You can selectively provide your consent below to allow such third party embeds. For complete information about the cookies we use, data we collect and how we process them, please check our Privacy Policy
Youtube
Consent to display content from - Youtube
Vimeo
Consent to display content from - Vimeo
Google Maps
Consent to display content from - Google

info(at)materiability.com