Attractors
Overview

In this tutorial you will learn how to make a pattern of circles, each radius of which changes according to the distance to a certain coordinate. The algorithm is based on a rectangular grid that defines a place for every circle. When an attractor point is set, a graph map may be applied to formulate an attracting law. If needed, a boundary curve might be used to limit the area, where the formula of attraction is applied. It is also possible to make a fade effect so as to reduce the size of the circles near the boundary curve.

In the image above, lines are drawn between an attractor point and the center point of each circle. These distances are used to define the size of the circles so they are always smaller closer to the attractor point. This same attractor could be used to change other parameters of the circles. For example, circles could be oriented so they are always facing the attractor point.

Instructions
Fredrik Skåtar, Aleksandra Sviridova

Duration
60 min

Level
Basic

→ DOWNLOAD PDF


Setting up a grid

Double-click any place on the canvas and start typing the name of the component in an opened Key Word search window. You can also find any component in the panel and click it or drag and drop it to the canvas. Double click the name of the Slider component to open the Slider Editor if you need to change it’s parameters.

You can also set the grid by directly connecting it with the corresponding sliders but the method below is more flexible.

Setting an attraction formula

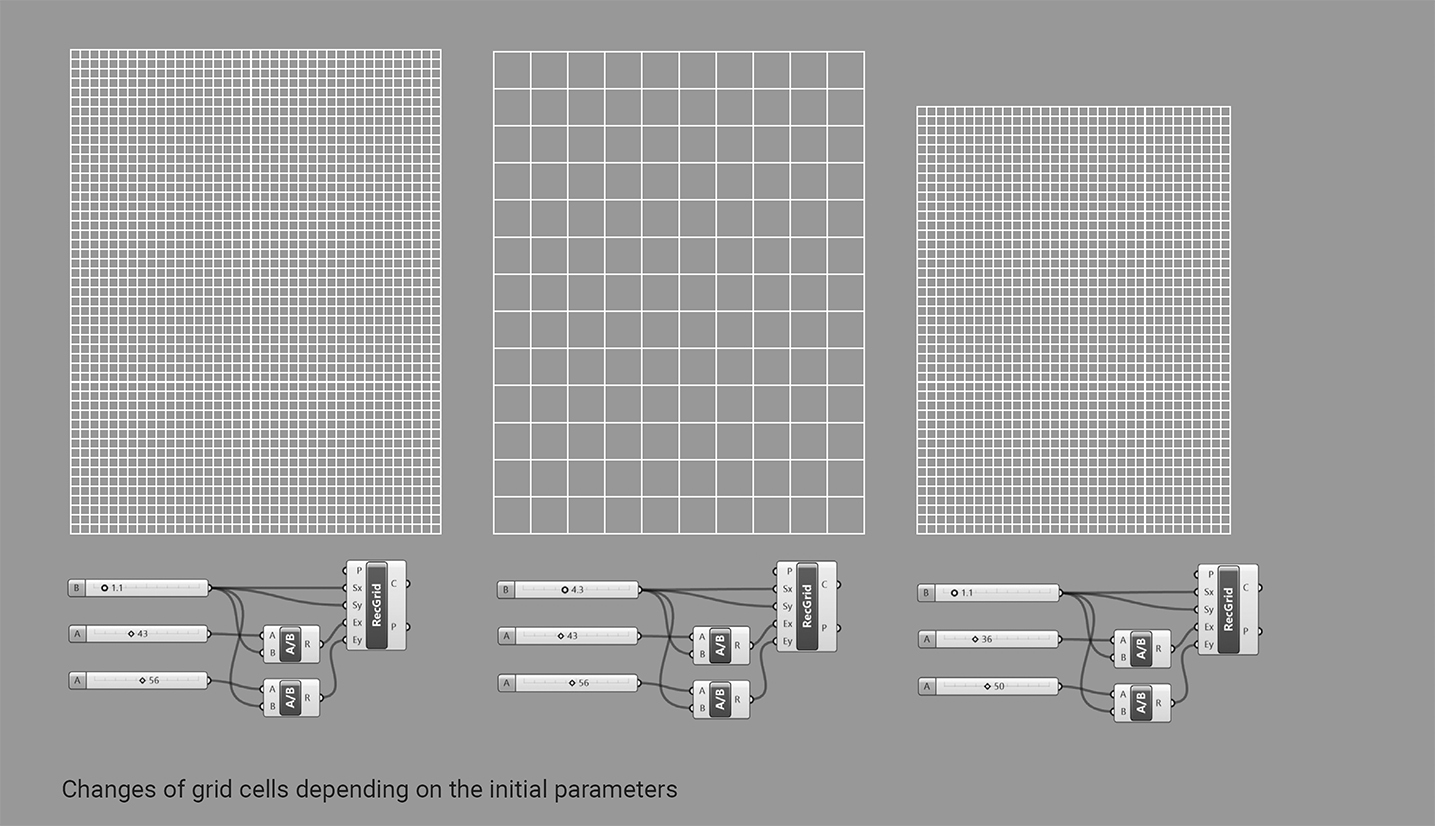
The Distance component computes distances between every point at the grid corners and the indicated attractor point. To set the attractor point right-click the Point component and choose Set one Point or Set Multiple points if more than on point is needed. The Rhino workspace will become active and you will be able to select the points you want to set as attractors. The Slider and the Division components make controlling the radii more flexible.

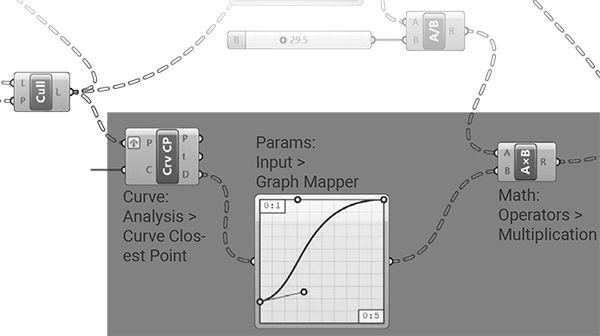
To set the graph in Graph Mapper right-click on the component, then select Sine or any other type of graph in Graph Types menu. To open the Graph Editor double-click the component. For more visible result set X[1] and Y[1] parameters to 20.
It is very important to graft the A parameter of the Distance component (and the Plane parameter of the Circles component). To do so, right-click this parameter and select Graft in the menu.

Setting a boundary curve and making a fade effect

Draw a closed curve in the Rhino canvas. Reference it to the Curve component in Grasshopper just the same way you used for the attractor points. Use the Point in Curve component to determine whether grid points are inside the defined curve. Set the Panel component to 2 as it means “Inside” according to Relationship output of the Point in Curve component. The Equal component will then determine those elements that are inside and Cull Pattern will exclude the others.

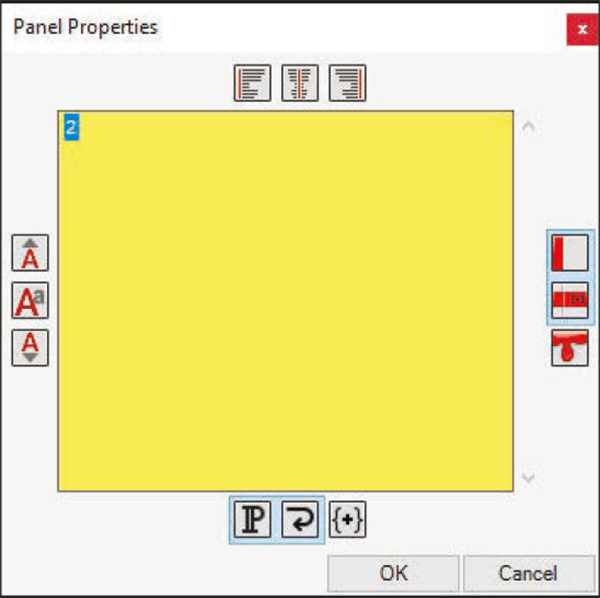
You can double-click anywhere on the canvas to launch a Key Word search and type double Slash to immediately find the Panel component. Double-click the Panel component to open it’s properties. Type “2” instead of example text. Make sure there is no punctuation.

The Cull component removes elements according to a repeating bit mask (in our case those outside the curve). This mask is defined as a list of Boolean (true or false) values.

To make a fade effect add one more Graph Mapper component and select Bezier in Graph Types menu. The result looks nicer if you increase the X[1] value in Graph Editor. Use the Curve Closest Point component to find the points that are closest to the boundary. Don’t forget to graft the Point input parameter. Add the Multiplication component to affect the radii circles so that they fade according to the defined graph.

Complete Grasshopper script.

Institute
Materiability Research Group

Instructions
Fredrik Skåtar, Aleksandra Sviridova

Duration
60 min

Level
Medium


Privacy Settings
We use cookies to enhance your experience while using our website. If you are using our Services via a browser you can restrict, block or remove cookies through your web browser settings. We also use content and scripts from third parties that may use tracking technologies. You can selectively provide your consent below to allow such third party embeds. For complete information about the cookies we use, data we collect and how we process them, please check our Privacy Policy
Youtube
Consent to display content from - Youtube
Vimeo
Consent to display content from - Vimeo
Google Maps
Consent to display content from - Google

info(at)materiability.com