data-driven materialisation
With the continuous rise of smartwatches, fitness trackers and other wearable devices the amount of personal data that one constantly collects keeps growing endlessly. Steps, active energy, sleep, heart rate, blood sugar, blood pressure, weight, calories, nutrition, water intake, meditation, activities, places, means of transport, screen time, productivity, workouts, mood, stairs, body-fat, social interaction, music are just a few of the things that can be easily recorded. Most of this data leads to something that is commonly referred to as the “quantified self,” which is both a cultural phenomenon of self-tracking through technology and a community of consumers and suppliers of self-tracking tools who share an interest in self-knowledge and personal improvement through numbers.
Whilst the quantified self-movement has faced varied criticism related mostly to issues of data privacy and health literacy skills, the focus of this course was less on individual perfection or social challenges but rather on the question, how these tools could be useful for us as designers.
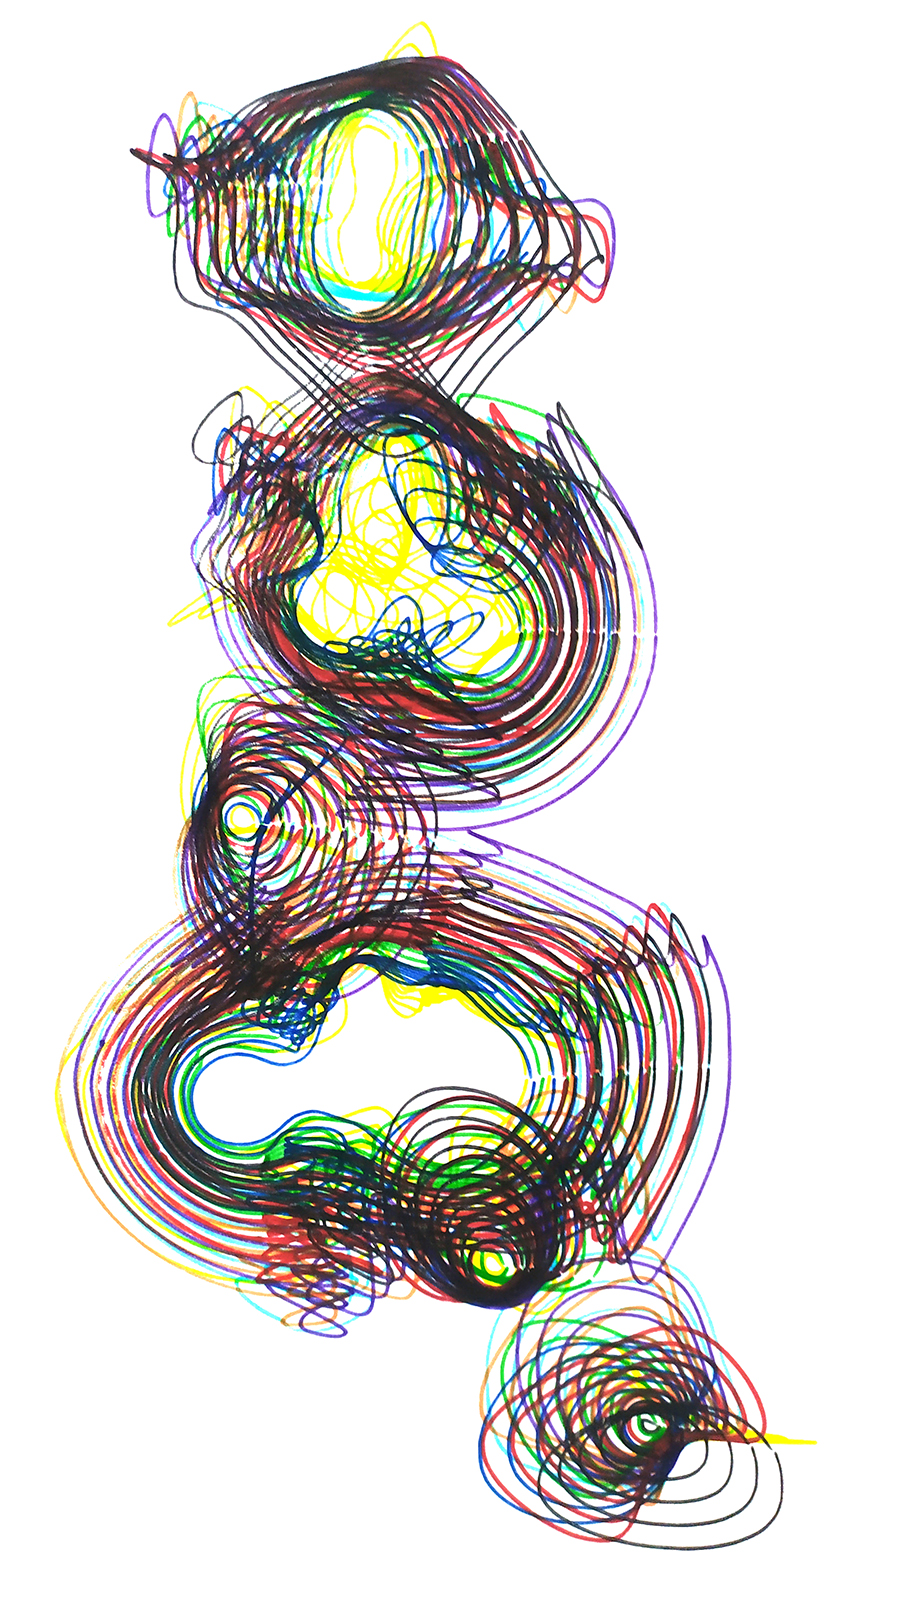
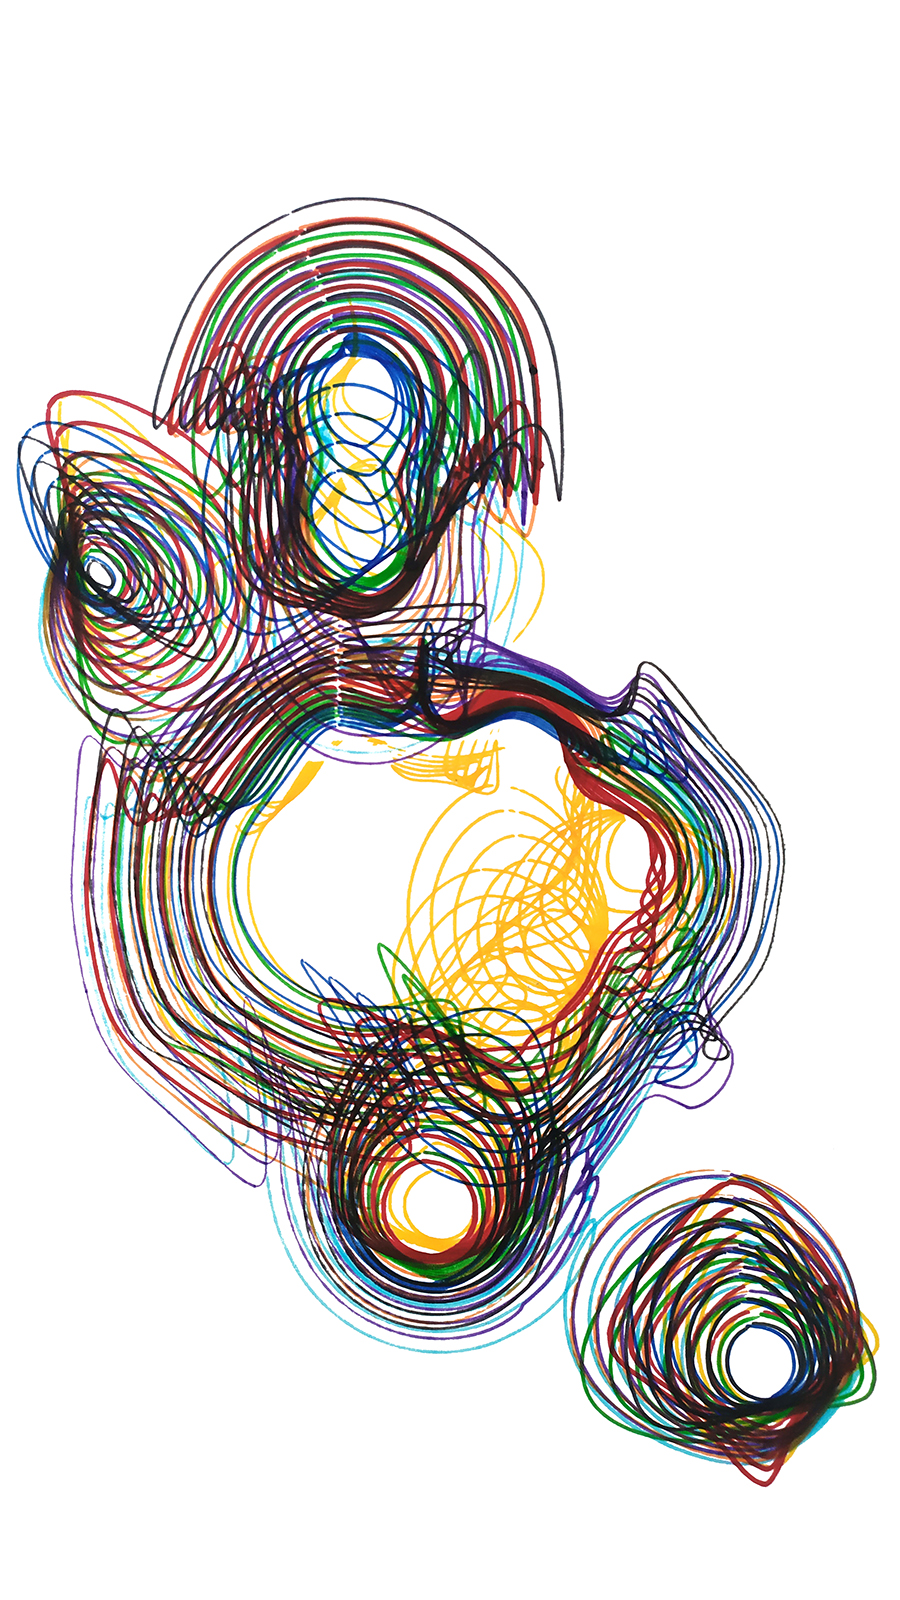
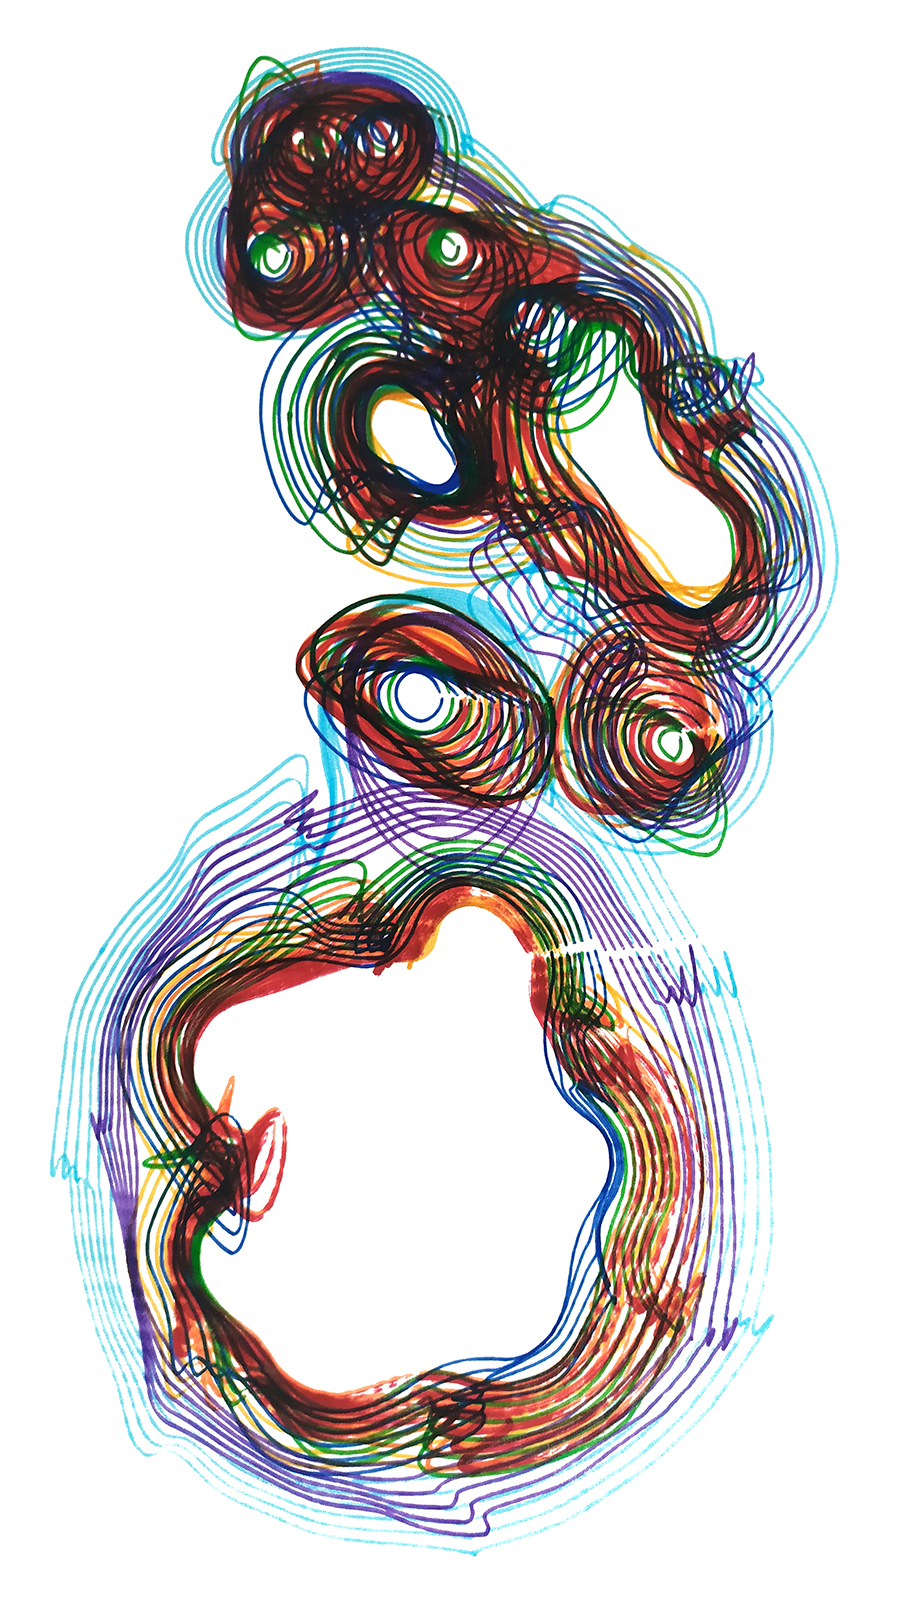
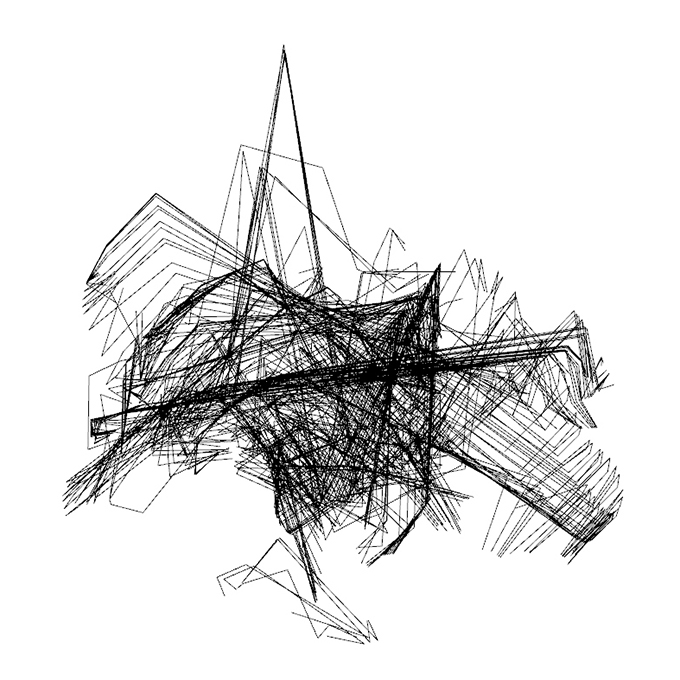
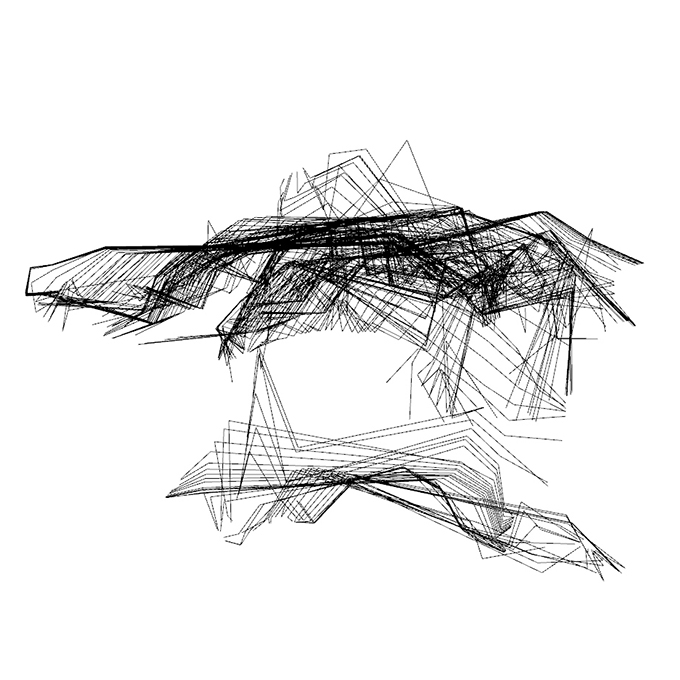
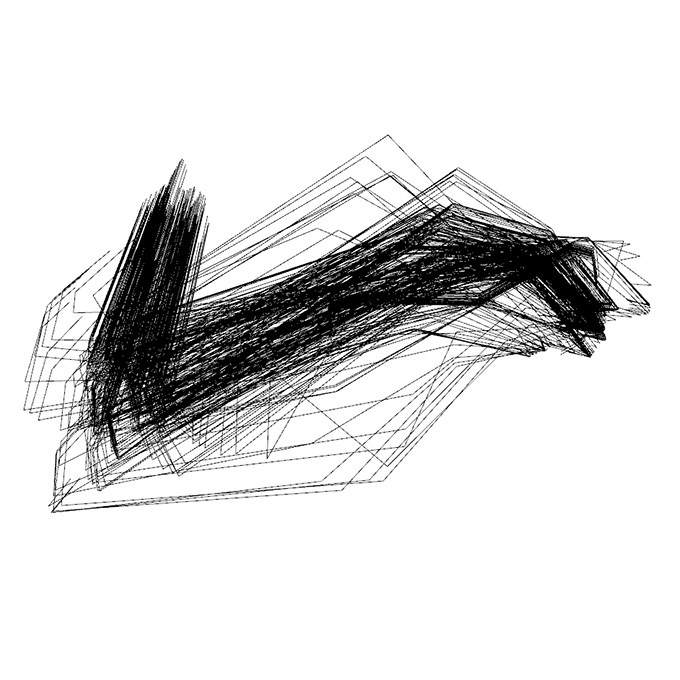
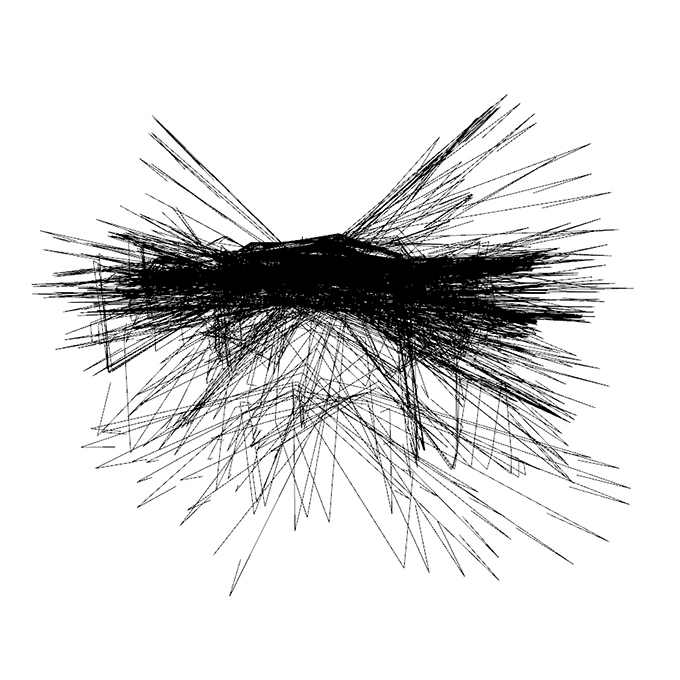
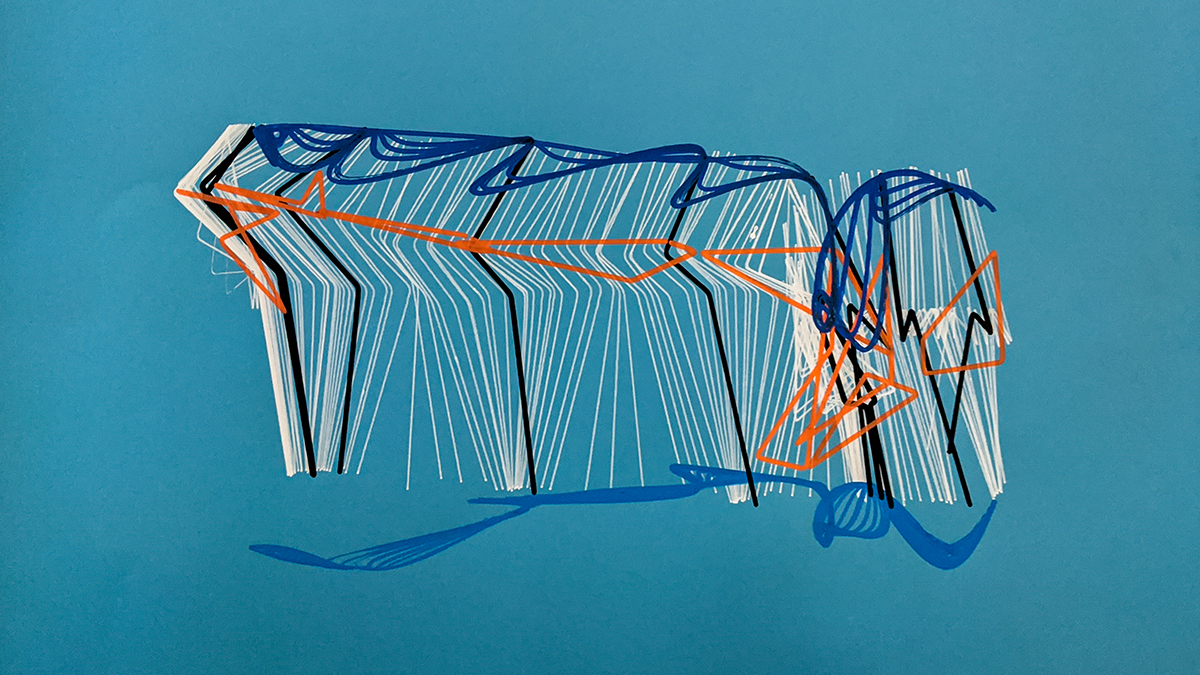
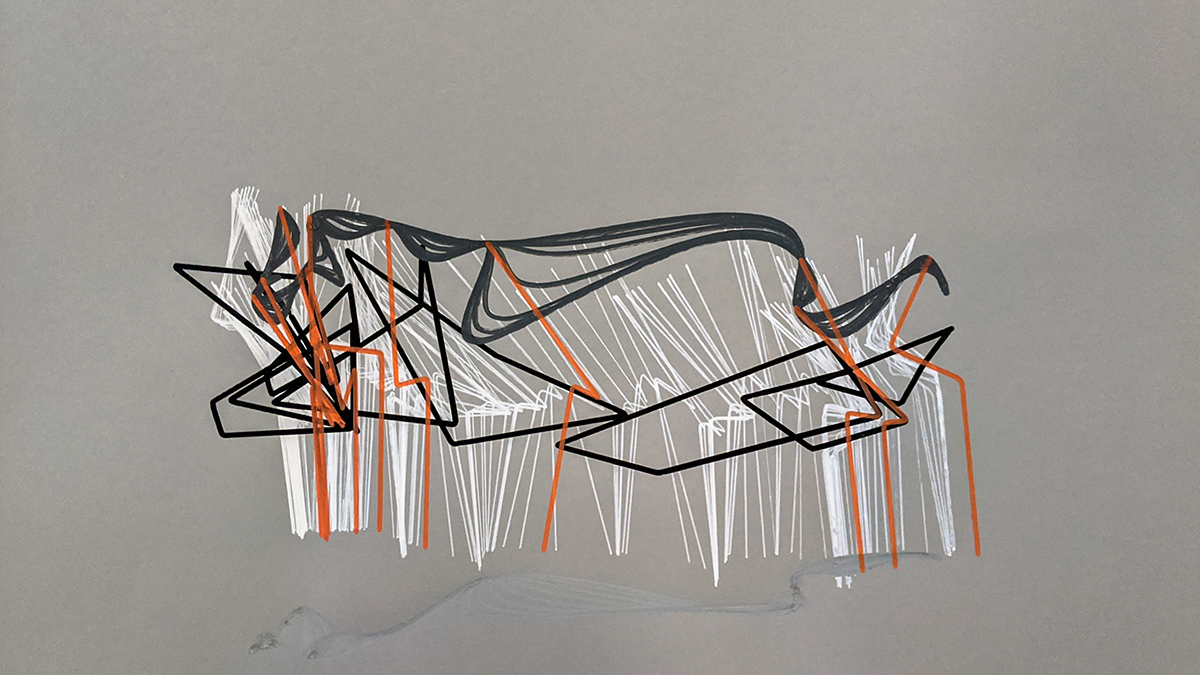
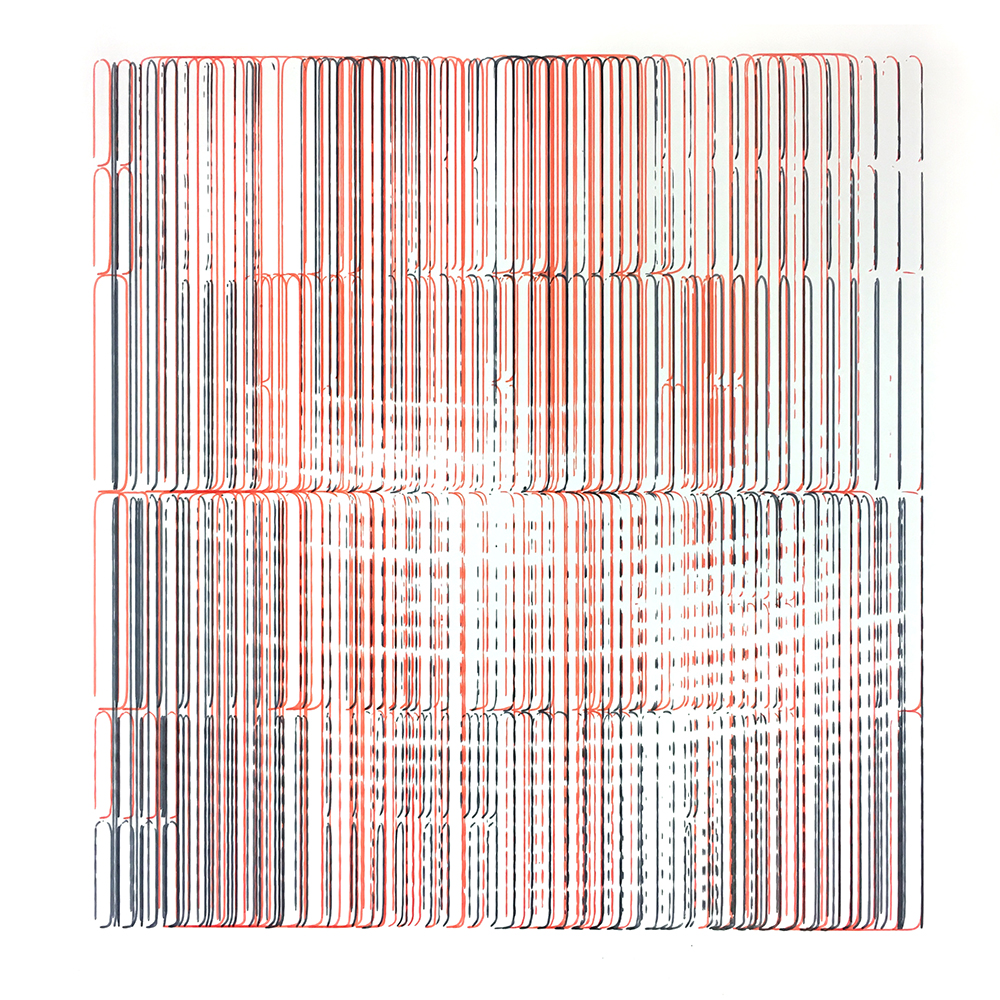
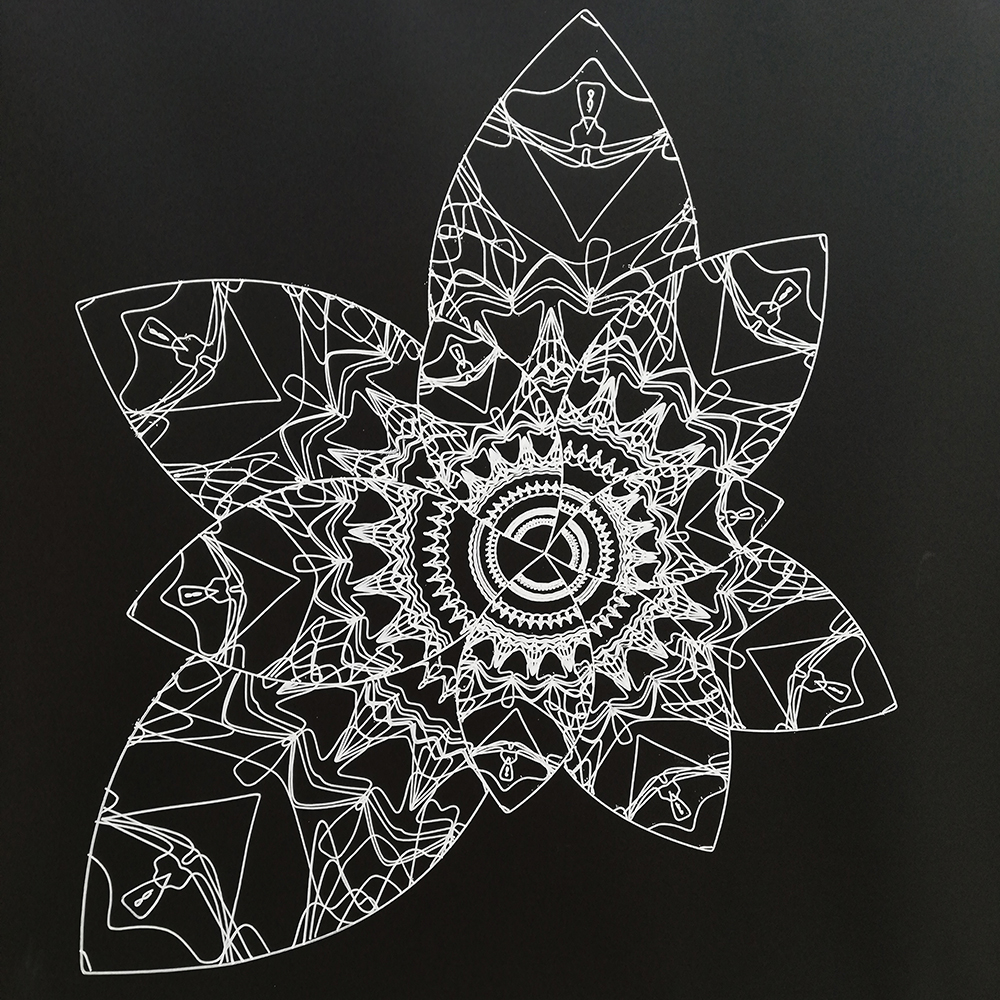
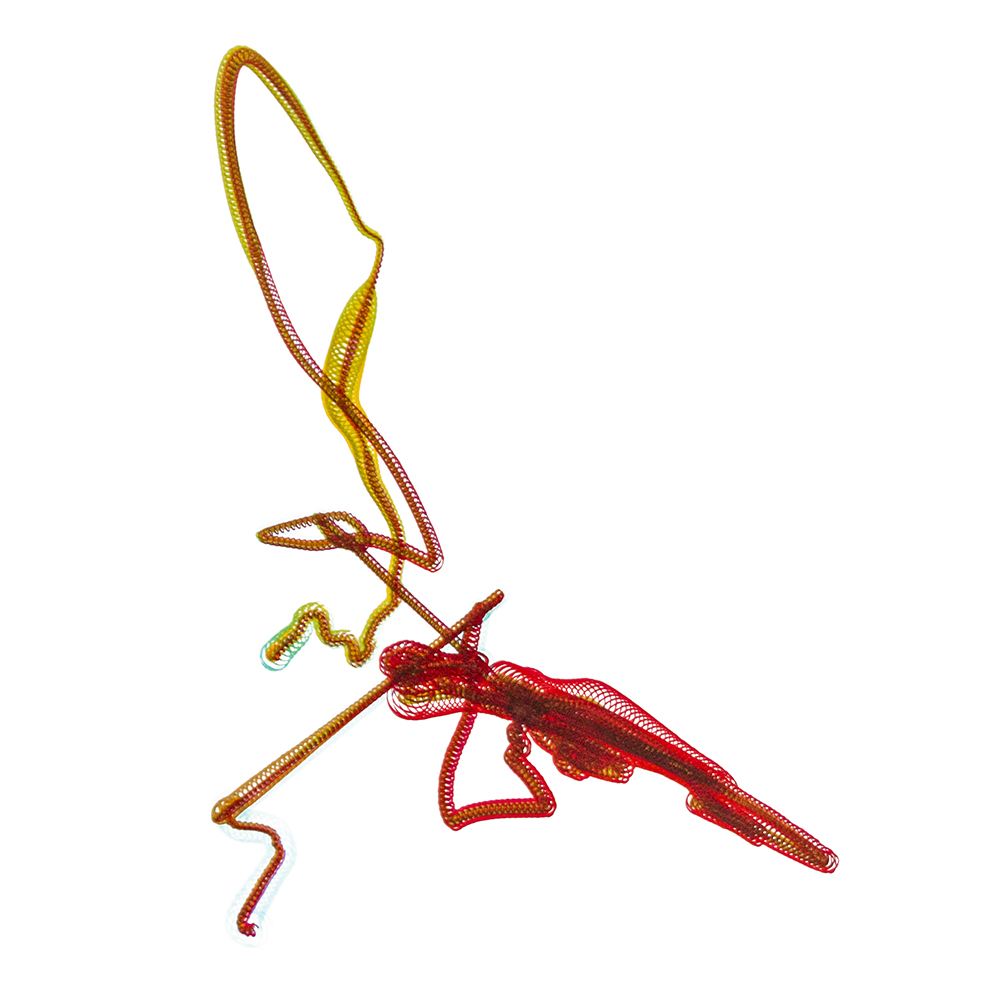
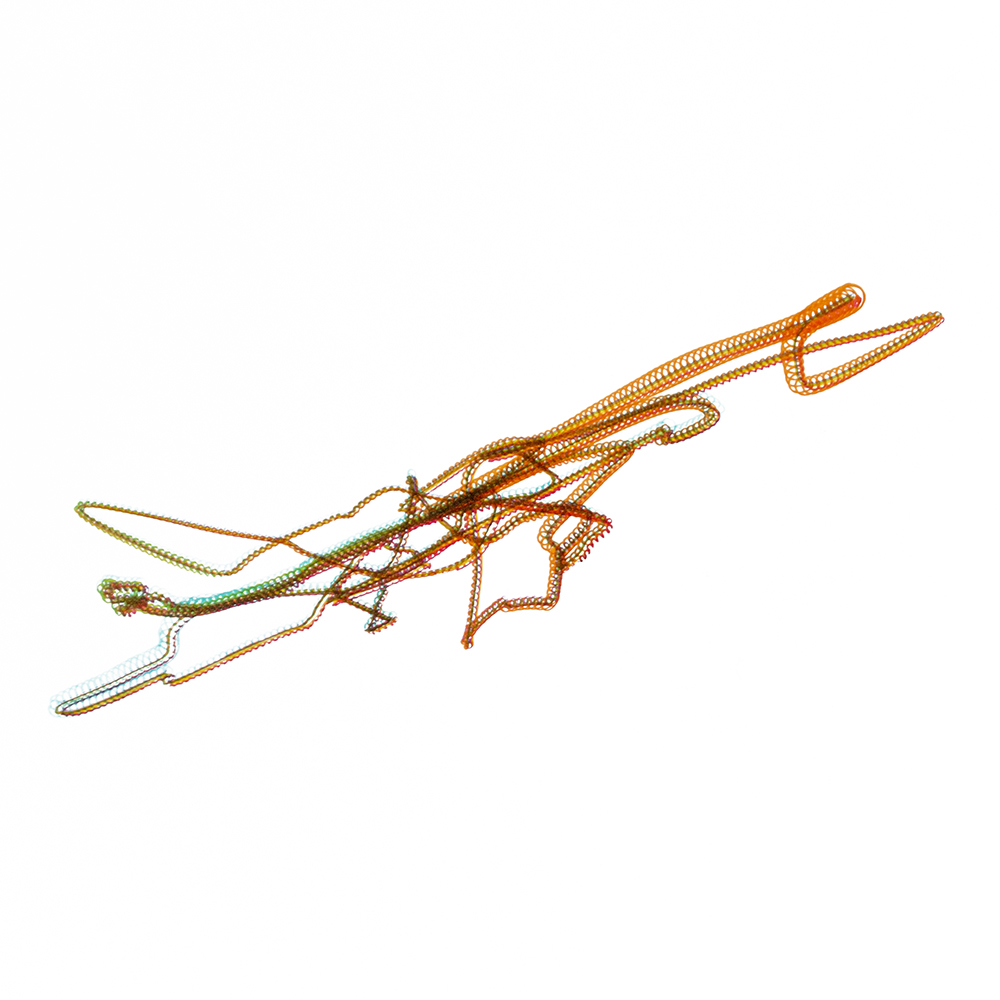
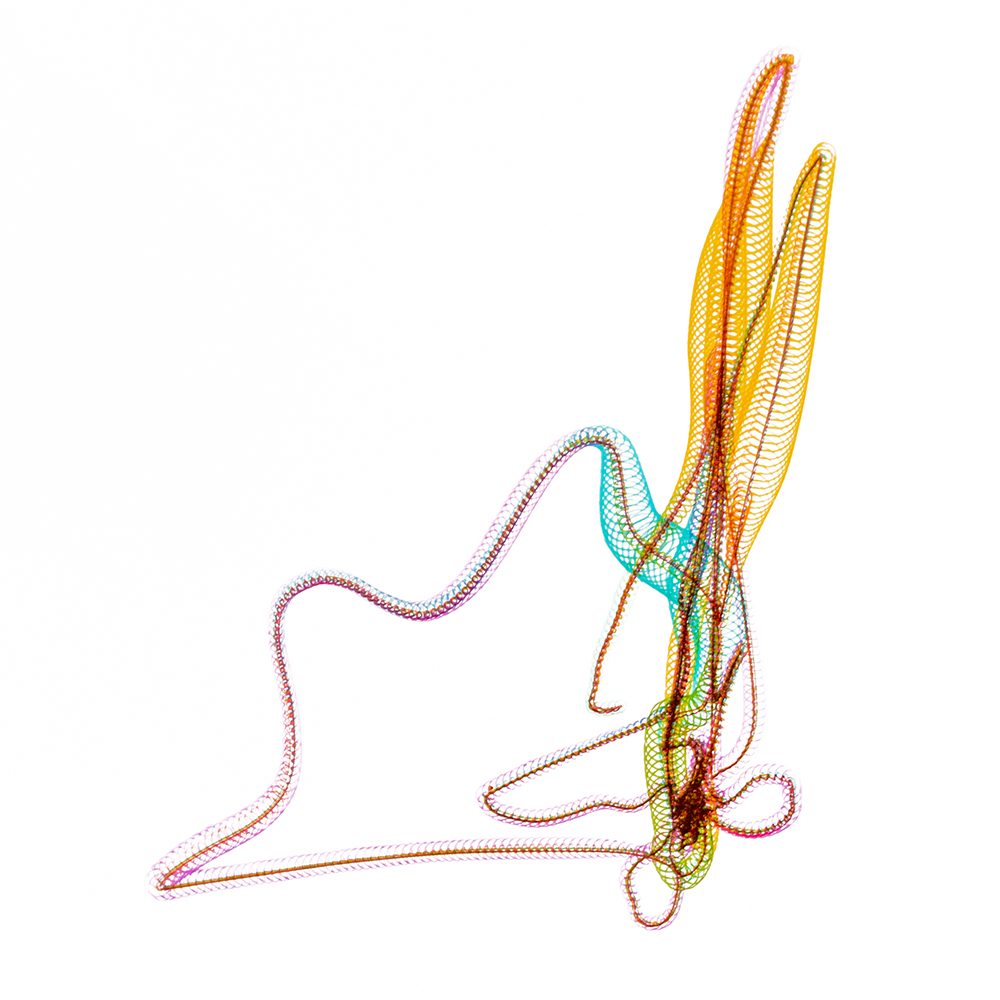
Students in this course worked in interdisciplinary teams, comprised of both architecture and design students. The first task was to understand and decide what types of personal data each group can collect, how they vary among different persons and situations and how they can be compared or combined. Depending on the extent of these numeric figures the groups were then asked to develop methods to manipulate and translate the results and finally decide on how they can be visualized using an industrial robot. The sets of paintings should both show that they belong to the same procedure but also stand for their individuality.
Topography of Boredom
People today can not imagine their lives without smartphones. They are no longer just devices for communication but have become an extension of our brains. Smartphone sensors collect hundreds of different sets of data every few seconds. What if these sets of data can be a design driver?
We decided that such data could be used in architecture, especially urbanism. We focused on the fact that certain areas of a city are usually much more attractive to people than the others. Sometimes it is a matter of crossing pedestrian paths or a well-placed public space. But sometimes things are not so obvious, like the old shady tree you want to sit under or an interesting sculpture in the park you see every day walking your dog. Our hypothesis was that in an interesting place you want to spend time and even take photos, but a boring one you want to leave as soon as possible. The aim of our project was to identify such attractive places on the campus of our university and develop a model that can then be used on a larger scale of the city. We believe that such data in the future will be able to indicate which spaces are “working” and which need changes and rethinking.


